
Human Population Genetics and Genomics ISSN 2770-5005
Human Population Genetics and Genomics 2026;6(2):0008 | https://doi.org/10.47248/hpgg2606020008
Original Research Open Access
Post-admixture selection favours Duffy negativity in the Lower Okavango Basin
Artem Kasianov
1,2

 ,
Anne-Maria Fehn
1,2
,
Maitseo Bolaane
3
,
Gaseitsiwe Masunga
4
,
Ezequiel Chimbioputo Fabiano
1,2,5
,
Jorge Rocha
1,2,6
,
Anne-Maria Fehn
1,2
,
Maitseo Bolaane
3
,
Gaseitsiwe Masunga
4
,
Ezequiel Chimbioputo Fabiano
1,2,5
,
Jorge Rocha
1,2,6
Correspondence: Artem Kasianov
Academic Editor(s): Carina Schlebusch
Received: Mar 29, 2026 | Accepted: Jun 5, 2026 | Published: Jun 29, 2026
© 2026 by the author(s). This is an Open Access article distributed under the Creative Commons License Attribution 4.0 International (CC BY 4.0) license, which permits unrestricted use, distribution, and reproduction in any medium or format, provided the original work is correctly credited.
Cite this article: Kasianov A, Fehn A, Bolaane M, Masunga G, Fabiano EC, Rocha J. Post-admixture selection favours Duffy negativity in the Lower Okavango Basin. Hum Popul Genet Genom. 2026;6(2):0008. https://doi.org/10.47248/hpgg2606020008
The FY*BES allele in the human Duffy blood group is nearly fixed across much of sub-Saharan Africa. Individuals homozygous for this allele (Duffy-negative) were considered resistant to red blood cell invasion by the malaria parasite Plasmodium vivax, restricting its distribution across the continent. However, recent studies have demonstrated that P. vivax can infect Duffy-negative individuals and is widespread among African populations where FY*BES predominates. As these findings may challenge the long-standing assumption that P. vivax protection is the driving force elevating FY*BES frequencies, the evolutionary relationship between Duffy negativity and parasite resistance should be re-evaluated across diverse geographic, ecological and epidemiological settings. Previous research investigating the role of natural selection in increasing the frequency of the FY*BES allele has primarily centered on admixed populations with African and non-African ancestries from regions with long-documented P. vivax transmission. Here, we focus on the Khwe foragers from the lower Okavango River Basin of northern Namibia and Botswana, where the parasite has only recently been reported. Using locus-specific statistics, simulations of neutral scenarios, and local ancestry inference, we found evidence for strong post-admixture selection promoting FY*BES introgression from Bantu-speaking populations into the Khwe. If P. vivax resistance indeed drove the rise in FY*BES allele frequency, our findings suggest that the parasite has been present in the region at least 500 to 1,000 years ago.
KeywordsDuffy negativity, Plasmodium vivax, malaria resistance, post-admixture selection, Okavango River Basin
The human Duffy blood group (FY) antigens act as chemokine receptors and facilitate the invasion of red blood cells (RBC) by the malaria parasite Plasmodium vivax [1-3]. Most antigenic variation in FY is determined by three common alleles, FY*A, FY*B, and FY*BES , at the Atypical Chemokine Receptor 1 (ACKR1) gene on chromosome 1, also known as the Duffy Antigen Receptor for Chemokines (DARC) [4,5].
The FY*A (rs12075*G) and FY*B (rs12075*A) alleles synthesize functional transmembrane glycoproteins and are widespread in Eurasia and the Americas. FY*BES is an erythroid-silent (ES) FY*B variant that is nearly fixed in much of sub-Saharan Africa and carries an additional promoter mutation (rs2814778 T>C), which leads to the loss of FY antigen expression in red blood cells (RBC) [6–9].
Because homozygosity for the FY*BES allele (Duffy-negativity) was long thought to completely block P. vivax invasion of RBC, it has been hypothesized that selective pressure from vivax malaria caused the fixation of the allele, thus limiting the spread of the parasite across large regions of Africa due to the lack of susceptible hosts [1,10,11].
More recently, however, molecular diagnostic tools have revealed that Plasmodium vivax can infect Duffy-negative individuals and is widespread across African populations in which Duffy-negativity is near fixation [12–14]. The detection of P. vivax in regions where it was previously thought to be absent raises the question of whether the parasite was historically underdiagnosed or has more recently evolved alternative mechanisms to invade Duffy-negative erythrocytes [14–18]. As these findings complicate the interpretation of P. vivax as the primary selective force driving the spread of Duffy-negativity in Africa [14–18] it is important to examine the impact of natural selection on FY genotypes across diverse geographic, ecological, and epidemiological contexts.
So far, signatures of ongoing positive selection increasing FY*BES allele frequency have only been described in post-admixture settings involving sub-Saharan African ancestry and populations from outside sub-Saharan Africa, in areas where P. vivax has been historically prevalent [19–25].
Here, we investigate the role of natural selection in shaping FY*BES allele frequencies in the lower Okavango River Basin, a southern African region spanning Namibia and Botswana that forms a vast wetland system surrounded by the semi-arid Kalahari Desert (Figure S1). Despite strong seasonal fluctuations associated with rainfall, the region remains a focus of endemic malaria, with sustained annual transmission of Plasmodium falciparum, and lies within the southernmost ecologically suitable zone for stable P. vivax transmission in Africa [26–28]. However, evidence for P. vivax circulation in the lower Okavango River Basin was only recently obtained through the use of improved molecular diagnostic methods, with most detected infections occurring in Duffy-negative individuals [26,29–32].
Genetic, linguistic, and archaeological evidence indicates that the Okavango Basin is a major contact zone reflecting the complex settlement history of southern Africa, shaped by successive waves of migration and admixture among resident and incoming populations. The earliest known inhabitants were hunter-gatherer groups ancestral to present-day speakers of !Xun and Ju/’hoan. Approximately 2,000 years ago, Late Stone Age pastoralists originating from eastern Africa introduced Khoe-Kwadi languages, followed by the expansion of Iron Age Bantu-speaking farming populations from west-central Africa around 1,500 years ago. Interactions among these groups over time led to extensive genetic and cultural exchange, contributing to the high demographic, linguistic, and genetic diversity observed in contemporary populations of the area [33–35].
By combining locus-specific and local ancestry approaches using genome-wide data, we found strong evidence that post-admixture selection has promoted the diffusion of the FY*BES allele from Bantu-speaking populations into the Khoe-Kwadi–speaking Khwe, a foraging group, that arose from admixture between resident southern African hunter-gatherers, migrant herders from East Africa and Bantu-speaking agriculturalists originating in West Africa [36,37].
If P. vivax resistance is indeed responsible for the rise in FY*BES allele frequency, our findings indicate that the parasite was present in the region at least 500 to 1,000 years ago.
This study includes 149 newly genotyped individuals from two ethnolinguistic groups in Namibia and Botswana who passed quality control and relatedness filtering: the Khwe (114 individuals) and the Kwangali (35 individuals) (Figure S1; Table S1). The Khwe speak a Khoe-Kwadi language [38] and have traditionally subsisted on foraging in areas of the Okavango River Basin spanning across southeastern Angola, northeastern Namibia, and Botswana’s Okavango Delta [39]. Based on linguistic variation and livelihood patterns, the Khwe can be divided into two main subgroups, both of which are represented in our sample: the ǁAni-Khwe (30 individuals), primarily fishermen currently residing near the Okavango Delta in northwestern Botswana; and the non-ǁAni-Khwe (84 individuals), who speak closely related ǁXom, ǁXoo, and Buga varieties, and historically inhabited the drier regions to the east and north of the Okavango Delta [40] (Figures S1 and S2).
The Kwangali are a West Bantu-speaking group within the Kavango language cluster (K.33), who primarily practice agriculture along the Namibian and Angolan banks of the lower Okavango River [41].
All data were collected under the TwinLab collaborative network linking CIBIO/InBIO with the University of Namibia and the University of Botswana. Official research permits were granted by the Ministries of Health of Namibia (RPIV00722019) and Botswana (HPRD: 6/14/1). At each sampling site, the study was explained to participants in their native language by a bilingual translator. Written informed consent was obtained from all volunteers prior to sample collection. From each participant, we collected a saliva sample along with ethnolinguistic information, including ethnic affiliation, place of birth, and language spoken up to the grandparental generation.
We genotyped all sampled individuals using the Affymetrix Axiom Genome-Wide Human Origins Array [42], and performed quality control and filtering with PLINK v1.9 [43].
Non-biallelic single nucleotide polymorphisms (SNPs), SNPs with call error rates exceeding 10%, and non-autosomal SNPs were excluded. After filtering, a total of 553,841 SNPs remained. No individuals had missing rates greater than 10%. To filter out closely related individuals, we excluded one individual from each pair with estimated relatedness (PI_HAT) > 0.2 [43].
For comparative purposes, we merged our data with that of 130 individuals across 14 contextual African populations previously genotyped on the same array, also using PLINK v1.9 (Figure 1; Table S1). The intersection between the two datasets yielded a total of 535,116 SNPs.
To independently genotype SNPs rs2814778 and rs12075, which determine Duffy allelic variation, we used Sanger sequencing following polymerase chain reaction (PCR) amplification with previously described primers [7].

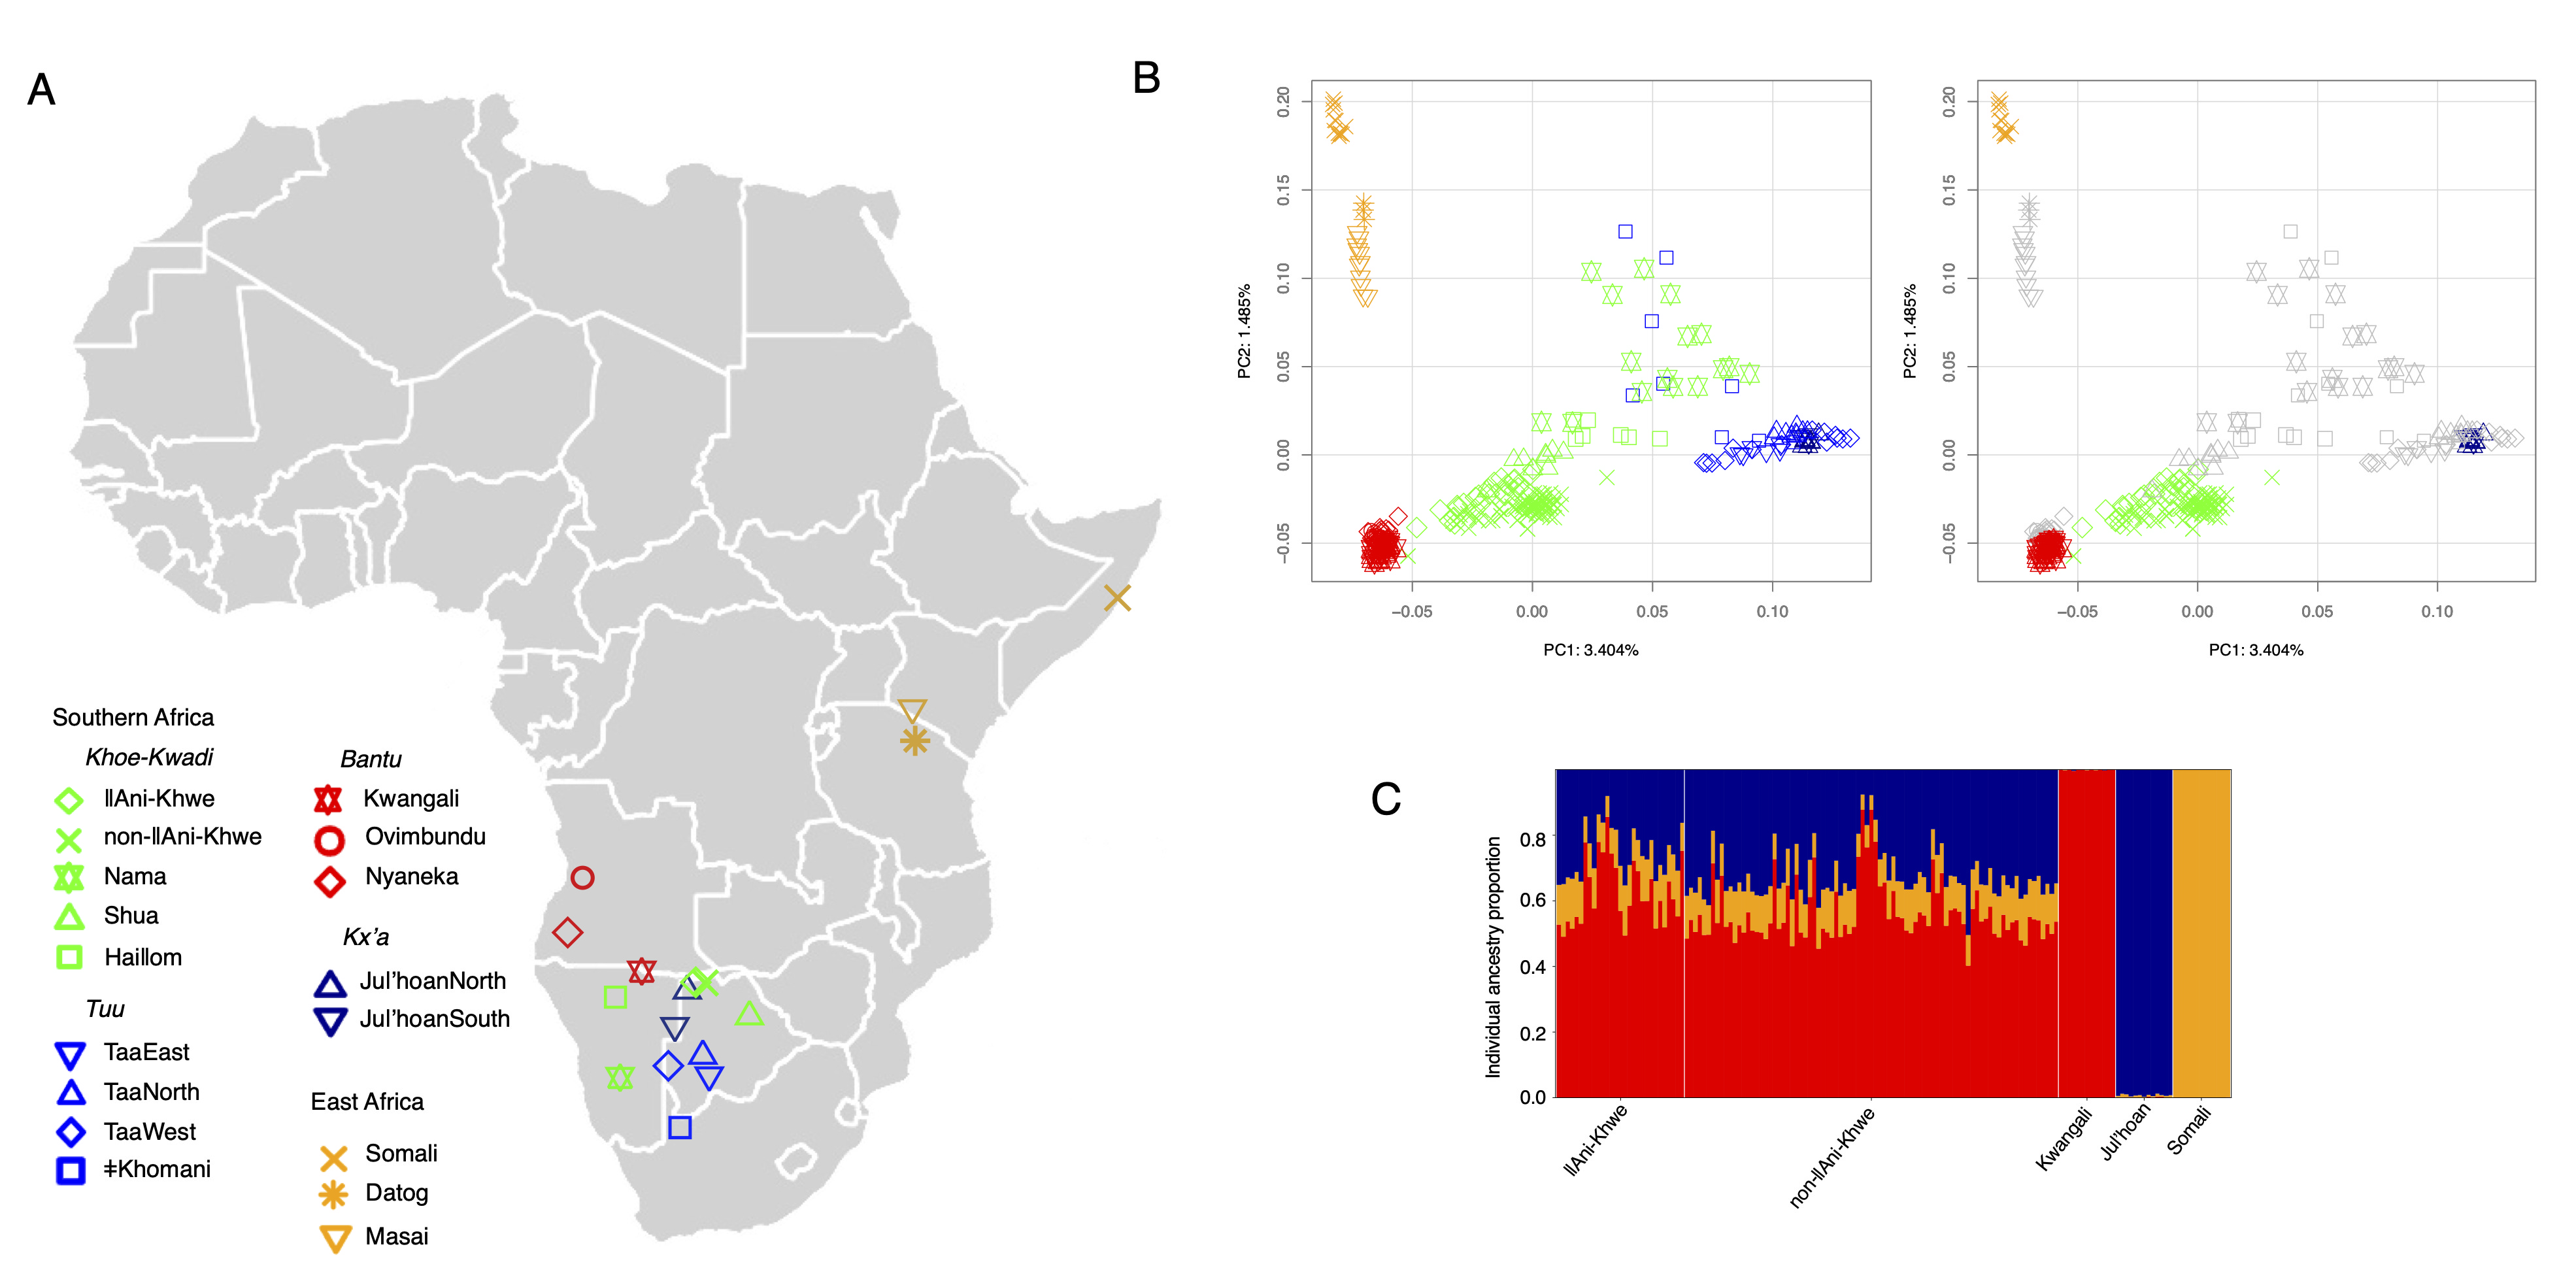
Figure 1. Population structure and admixture in the Khwe. (A) Map showing the approximate geographic locations of newly sampled and contextual populations. (B) PCA plots of the populations shown in the map. In the right panel, only Khwe individuals and parental populations are highlighted in colour. (C) Individual ancestry proportions inferred using RFMix v2. Vertical lines represent the estimated ancestry proportions for each individual.
Phasing was performed with Beagle 5.4 [44], employing the standard HapMap genetic map available on the Beagle website (https://faculty.washington.edu/browning/beagle/beagle.html).
To ensure results were not dependent on a specific phasing method, we also conducted analyses with SHAPEIT v2.r904 [45], using the HapMap b37 genetic map available on GitHub (https://github.com/odelaneau/shapeit4/tree/master/maps).
To examine population structure, we performed principal component analysis (PCA) using a dataset pruned for linkage disequilibrium (LD) with PLINK v1.9 [43]. The pruned dataset comprises 343,959 SNPs and was generated by removing SNPs with an r² value greater than 0.4 within 200-kb windows, shifted at 25 SNP intervals. Principal component scores were computed with PLINK and visualized with a PlotPCAs.r script.
Pairwise FST values between populations were calculated with EIGENSOFT [46,47] and visualized with a heatmap and Neighbour-Joining clustering using the R-packages ape and pheatmap [48–50].
Ancestry inference at the population, individual and local-levels was performed using RFMix v2 [51] with phased samples and a three-way admixture model.
The analysis included 114 Khwe individuals and employed four reference panels representing ancestries related to Bantu-speakers, indigenous southern African hunter-gatherers and eastern Africans. To maintain balanced panels, the number of individuals included from each source population was constrained by the smallest available sample size. The first panel consisted of 13 Kwangali (Bantu-related ancestry), 13 Juǀ’hoan (southern African hunter-gatherer-related ancestry), and 13 Somali (Afro-Asiatic eastern African-related ancestry) individuals.
To assess the influence of alternative parental populations on the detected local ancestry deviations, we tested three additional reference panels using the Hadza and Yoruba populations as alternative eastern African and Bantu-related source populations, respectively. The panels consisted of: (i) 13 Nyaneka individuals, 13 Juǀ’hoan individuals, and 13 Somali individuals; (ii) 15 Kwangali individuals, 15 Juǀ’hoan individuals, and 15 Hadza individuals; and (iii) 14 Nyaneka individuals, 14 Juǀ’hoan individuals, and 14 Hadza individuals.
Although the Hadza are hunter-gatherers with genetic profiles that differ substantially from those of most other eastern African populations [52,53], they were included as an alternative reference population in order to assess the robustness of local ancestry deviations to the choice of parental groups, rather than to model the eastern African pastoralist contribution directly.
We used a two SNP window size, three Expectation-Maximization iterations, and the option “reanalyze-reference” to account for possible admixture in the reference groups. To test the robustness of our results, we assumed two admixture times: 39 generations corresponding to the average between proposed dates of 60 generations ago for the initial admixture between East Africans and indigenous southern Africans, and 17 generations ago for the later admixture with Bantu-speaking groups [36]; and 25 generations corresponding to the average of 33 and 17 generations ago for the later admixture event [36,37].
Individual ancestry proportions were calculated by averaging the chromosome-specific ancestry estimates provided in RFMix Q output files and were visualized using a Python script (VisualizeAdmixture.rfmix.py). Population-level ancestry was then determined by averaging the individual ancestry proportions within each group.
Local ancestry assignments were performed using the RFMix fb output files, which provide marginal probabilities for each genomic window originating from a given parental population. Windows with marginal probabilities less than 1 represented 0.7% of total assignments (0.35%, 0.12% and 0.23% for Bantu, eastern African and southern African ancestries, respectively) and were excluded to remove segments with ambiguous ancestry assignments. Results were unchanged when local ancestry inference was performed without filtering low-confidence windows. SNPs located in centromeric regions and within 2 Mb of chromosome telomeres were additionally filtered out [54–56].
To evaluate whether the frequency of FY*BES in the Khwe population was higher than expected from admixture alone, we employed a binomial resampling approach, where the probability of success was defined as the product of the FY*BES allele frequency in the ancestral populations and their estimated admixture proportions [57]. The resampling procedure is implemented in the resampling.CLI.plots.py script.
To compare the FY*BES frequency elevation at the Duffy locus with deviations observed at other SNPs genotyped on the Genome-Wide Human Origins Array, we used the Fadm statistic, which measures, for each SNP, a normalized difference between observed allele frequencies in an admixed population, and frequencies expected from admixture proportions under neutrality [58].
We performed forward simulations under the Wright–Fisher model to generate expected distributions of FY*BES allele frequencies in the absence of selection, using the Wright_Fisher_simulator.py script. The simulated admixed population was modelled as initially formed through contributions from resident southern African hunter-gatherers and incoming East African herders, followed by a secondary admixture event involving Bantu-speaking populations. We investigated the outcomes of varying effective population sizes, parental allele frequencies, admixture dynamics, and number of generations since admixture on the resulting allele frequency distributions.
We applied a deterministic framework, using equation 10.25 from [59] to estimate selection coefficients (s) that could account for the observed FY*BES allele frequencies, given different initial allele frequencies and varying number of generations since admixture. Fitness (W) was parameterized relative to FY*BES homozygotes as: WFY∗BES/FY*BES=1; W FY∗ BES /FY*Other=1−hs, and WFY*Other /FY*Other=1−s, where FY*Other designates non-FY*BES alleles. Under this parametrization, h=1 corresponds to a fully recessive advantageous effect of FY*BES, with selection favouring only FY*BES homozygotes.
Allele frequency trajectories were calculated across a range of s values from 0 to 0.4, in increments of 0.001, using dominance coefficients (h) set at 1 (recessive model) or 0.5 (additive model). The selection coefficient that yielded the FY*BES allele frequency closest to the observed value was taken as the best estimate. The procedure was implemented using the Selection_coefficient_estimator.py script.
We assessed the population structure of the Khwe in comparison to other Khoe-Kwadi–speaking groups, as well as selected populations representing resident southern African, eastern African, and Bantu-related ancestries (Figure 1). In PCA, the Khwe are positioned between Bantu-speaking groups and Kx’a- and Tuu-speaking southern African hunter-gatherers (PC1 in Figure 1B), while also showing slightly greater proximity to eastern Africans than the Bantu populations included in this study (PC2 in Figure 1B). Pairwise FST estimates are consistent with the patterns of genetic differentiation observed in PCA (Figure S3).
Previous studies have shown that the genetic composition of the Khwe and other Khoe-Kwadi–speaking populations can be modelled as the result of an initial admixture between East African and indigenous southern African–related ancestries, followed by a second admixture event with incoming Bantu-speaking groups [36]. Assuming a generation time of 30 years [60], inferred dates for these events range from approximately 2,100–1,800 years ago (~70–60 generations ago) for the admixture between southern and eastern African ancestries, and from 1,000–500 years ago (~33–17 generations ago) for the admixture between the pre-Bantu hybrid population and the Bantu migrants [36,37,61,62].
Using RFMixv2 [51] and selecting the Kwangali, Juǀ’hoan, and Somali as proxies for the three parental populations, we estimated that Khwe individuals carry, on average, 58.0% Bantu-related ancestry (standard deviation (SD) 9.8%), 30.5% (SD 8.6%) resident southern African–related ancestry, and 11.5% (SD 2.6%) eastern African–related ancestry (Figure 1C; Table S2).
Our choice of parental populations was based on geographic, historical, and genetic criteria (Figure 1A; Figure S1). The West Bantu–speaking Kwangali, who inhabit the middle reaches of the Okavango River Basin, and the Kx’a-speaking Juǀ’hoan, who live to the west of the Okavango Delta, both show strong genetic affinities with groups that have a documented history of contact and admixture with the Khwe [35,37,63,64]. In addition, the Afro-Asiatic–speaking Somali share approximately 62% of their genome with a ~3,100-year-old individual from the Luxmanda pastoralist site in Tanzania, whose ancestry is closely related to the eastern African component found in modern Khoe-Kwadi–speaking populations [37,65].
As Khwe-speakers fall into two broad ethnolinguistic subgroups with slightly different genetic profiles (Figure 1B; Figure S2), here referred to as ǁAni-Khwe and non-ǁAni-Khwe, we additionally report results for these two sample subsets. On average, ǁAni-Khwe individuals show higher Bantu-related ancestry (62.6% vs. 56.3%) and lower resident southern African–related ancestry (25.5% vs. 32.2%) compared to non-ǁAni-Khwe individuals (Table S2). Despite these differences, the overall ancestry profiles are consistent with previous estimates—obtained with different methods and smaller sample sizes—showing that the Khwe carry a higher proportion of Bantu than resident southern African–related ancestry [36,37] (Table S2).
We next investigated whether the frequency of FY*BES in the Khwe was higher than expected from admixture alone [57,66].
Because the SNPs rs12075 and rs2814778, which determine Duffy allelic variation, are not included in the Affymetrix Axiom Genome-Wide Human Origins array, we directly genotyped these two polymorphisms in the 114 Khwe and 26 Kwangali (Table S3). For the Somali and Juǀ’hoan populations, we used previously published FY*BES allele frequencies [67,68] (Table S4).
Using a binomial resampling procedure with 10⁶ replicates, we found that the observed FY*BES frequency of 94% in the Khwe is significantly higher (p < 10⁻⁶) than the 72% expected on the basis of their estimated ancestry proportions (Table S2) and the current FY*BES allele frequencies in the Kwangali (100%), Juǀ’hoan (11%), and Somali (92%) source populations (Figure S4; Table S4). Previous estimates of Khwe ancestry proportions based on different methods and parental populations consistently yielded expected FY*BES frequencies below 72% (Table S5) [36,37,69].
We further note that the use of present-day FY*BES frequencies in both resident southern African and eastern African reference populations is likely to overestimate the allele frequencies in the ancestral populations that contributed to the Khwe. In particular, FY*BES was likely introduced into Juǀ’hoan and other resident southern African groups through relatively recent admixture with Bantu-speaking populations [70].
The situation in eastern Africa is more uncertain: high FY*BES frequencies have been documented not only in the Somali, but also in other eastern African pastoralist populations, including the Maasai from Kenya (0.93; [71]) and populations across Sudan (average 0.92), where selection signals have been reported in several groups, including Afro-Asiatic speakers [24]. These observations suggest that FY*BES was already widespread in parts of eastern Africa prior to admixture between Bantu-speaking populations and resident eastern Africans around ~1,000 years ago [62,65,72]. However, admixture dates between Nilo-Saharan and Afro-Asiatic groups (~1,000–1,500 years ago [24]) still postdate the proposed arrival of eastern African pastoralists in southern Africa ~2,000 years ago, making it likely that ancestral eastern African populations carried FY*BES at lower frequencies than those observed today.
Accordingly, the expected FY*BES frequency in the Khwe under neutrality likely falls between two extremes: a lower bound in which the pre-Bantu eastern and southern African ancestral populations entirely lacked FY*BES, yielding an expected frequency close to the Bantu ancestry proportion (~58%), and an upper bound based on present-day Somali frequencies, yielding the more conservative estimate of ~72%. Under either scenario, the discrepancy with the observed FY*BES frequency of 94% remains substantial.
To further evaluate this deviation, we assessed the genome-wide distribution of the per-SNP Fadm statistic [58] to determine whether the divergence at the Duffy locus was unusually extreme compared to other loci. Notably, only 0.03% of all SNPs exhibited Fadm values equal to or greater than that of rs2814778, the SNP defining the FY*BES allele—even under the most conservative assumptions for parental allele frequencies: Kwangali 100%, Juǀ’hoan 11%, and Somali 92% (Figure S5).
In a less conservative scenario, assuming that the FY*BES allele was absent in the pre-Bantu hybrid population, rs2814778 displayed the highest genome-wide Fadm value (Figure S5).
While the empirical genome-wide distribution of Fadm values may be influenced by SNP ascertainment, the outlier status of the Duffy locus suggests that the elevated frequency of FY*BES is unlikely to be explained by neutral evolutionary processes alone.
To further assess whether the elevated frequency of FY*BES in the Khwe could be explained by genetic drift, we conducted simulations under a Wright–Fisher model. We explored a general framework in which a pre-Bantu population is first formed through a single pulse of admixture between southern African foragers and eastern African herders, followed by subsequent genetic contributions from Bantu-speaking migrants (Figure 2; Table S6).
Bantu ancestry was modelled as a second discrete admixture pulse (Figure 2A) or as continuous gene flow into the pre-Bantu population (Figure 2B), consistent with the spread of Khwe individuals along the PC1 axis in Figure 1B. Each admixture scenario was tested using two different sets of FY*BES allele frequencies in the parental populations: a more conservative set based on current frequencies in Juǀ’hoan (11%) and Somali (92%) (Figure 2C-D and G-H), and a less conservative set assuming that the FY*BES allele was introduced solely via Bantu-speaking groups (Figure 2E-F and I-J). All simulations used a previously estimated date of 60 generations for admixture between southern and eastern African populations [36], while the timing of Bantu admixture was allowed to vary between 60 and 25 generations ago, spanning the upper range of estimates for admixture between Bantu speakers and pre-Bantu groups in southern Africa [36, 37, 61,62,73].
Each admixture scenario and set of parental allele frequencies was further combined with varying effective population sizes (Figure 2D,F,H,J) to assess the probability of reaching the observed FY*BES frequency of 94% by drift alone. We conducted 100,000 replicates for each of 44 demographic configurations (Table S6).
Except for a single highly conservative condition involving early Bantu admixture, small effective population sizes (N=200), and high initial FY*BES frequencies in the pre-Bantu hybrid population (Figure 2C; scenario 1 in Table S6), all remaining 43 tested scenarios resulted in fewer than 5% of simulations reaching or exceeding the observed 94% frequency (Figure 2; Table S6).
Using a more conservative 99% quantile threshold, only five additional scenarios were compatible with genetic drift under conditions of small effective population size (scenarios 2, 3, 12, 23, and 24 in Table S6).
These findings suggest that the high FY*BES frequency observed in the Khwe is unlikely to be fully explained by genetic drift alone and are consistent with positive selection acting on the allele after admixture.
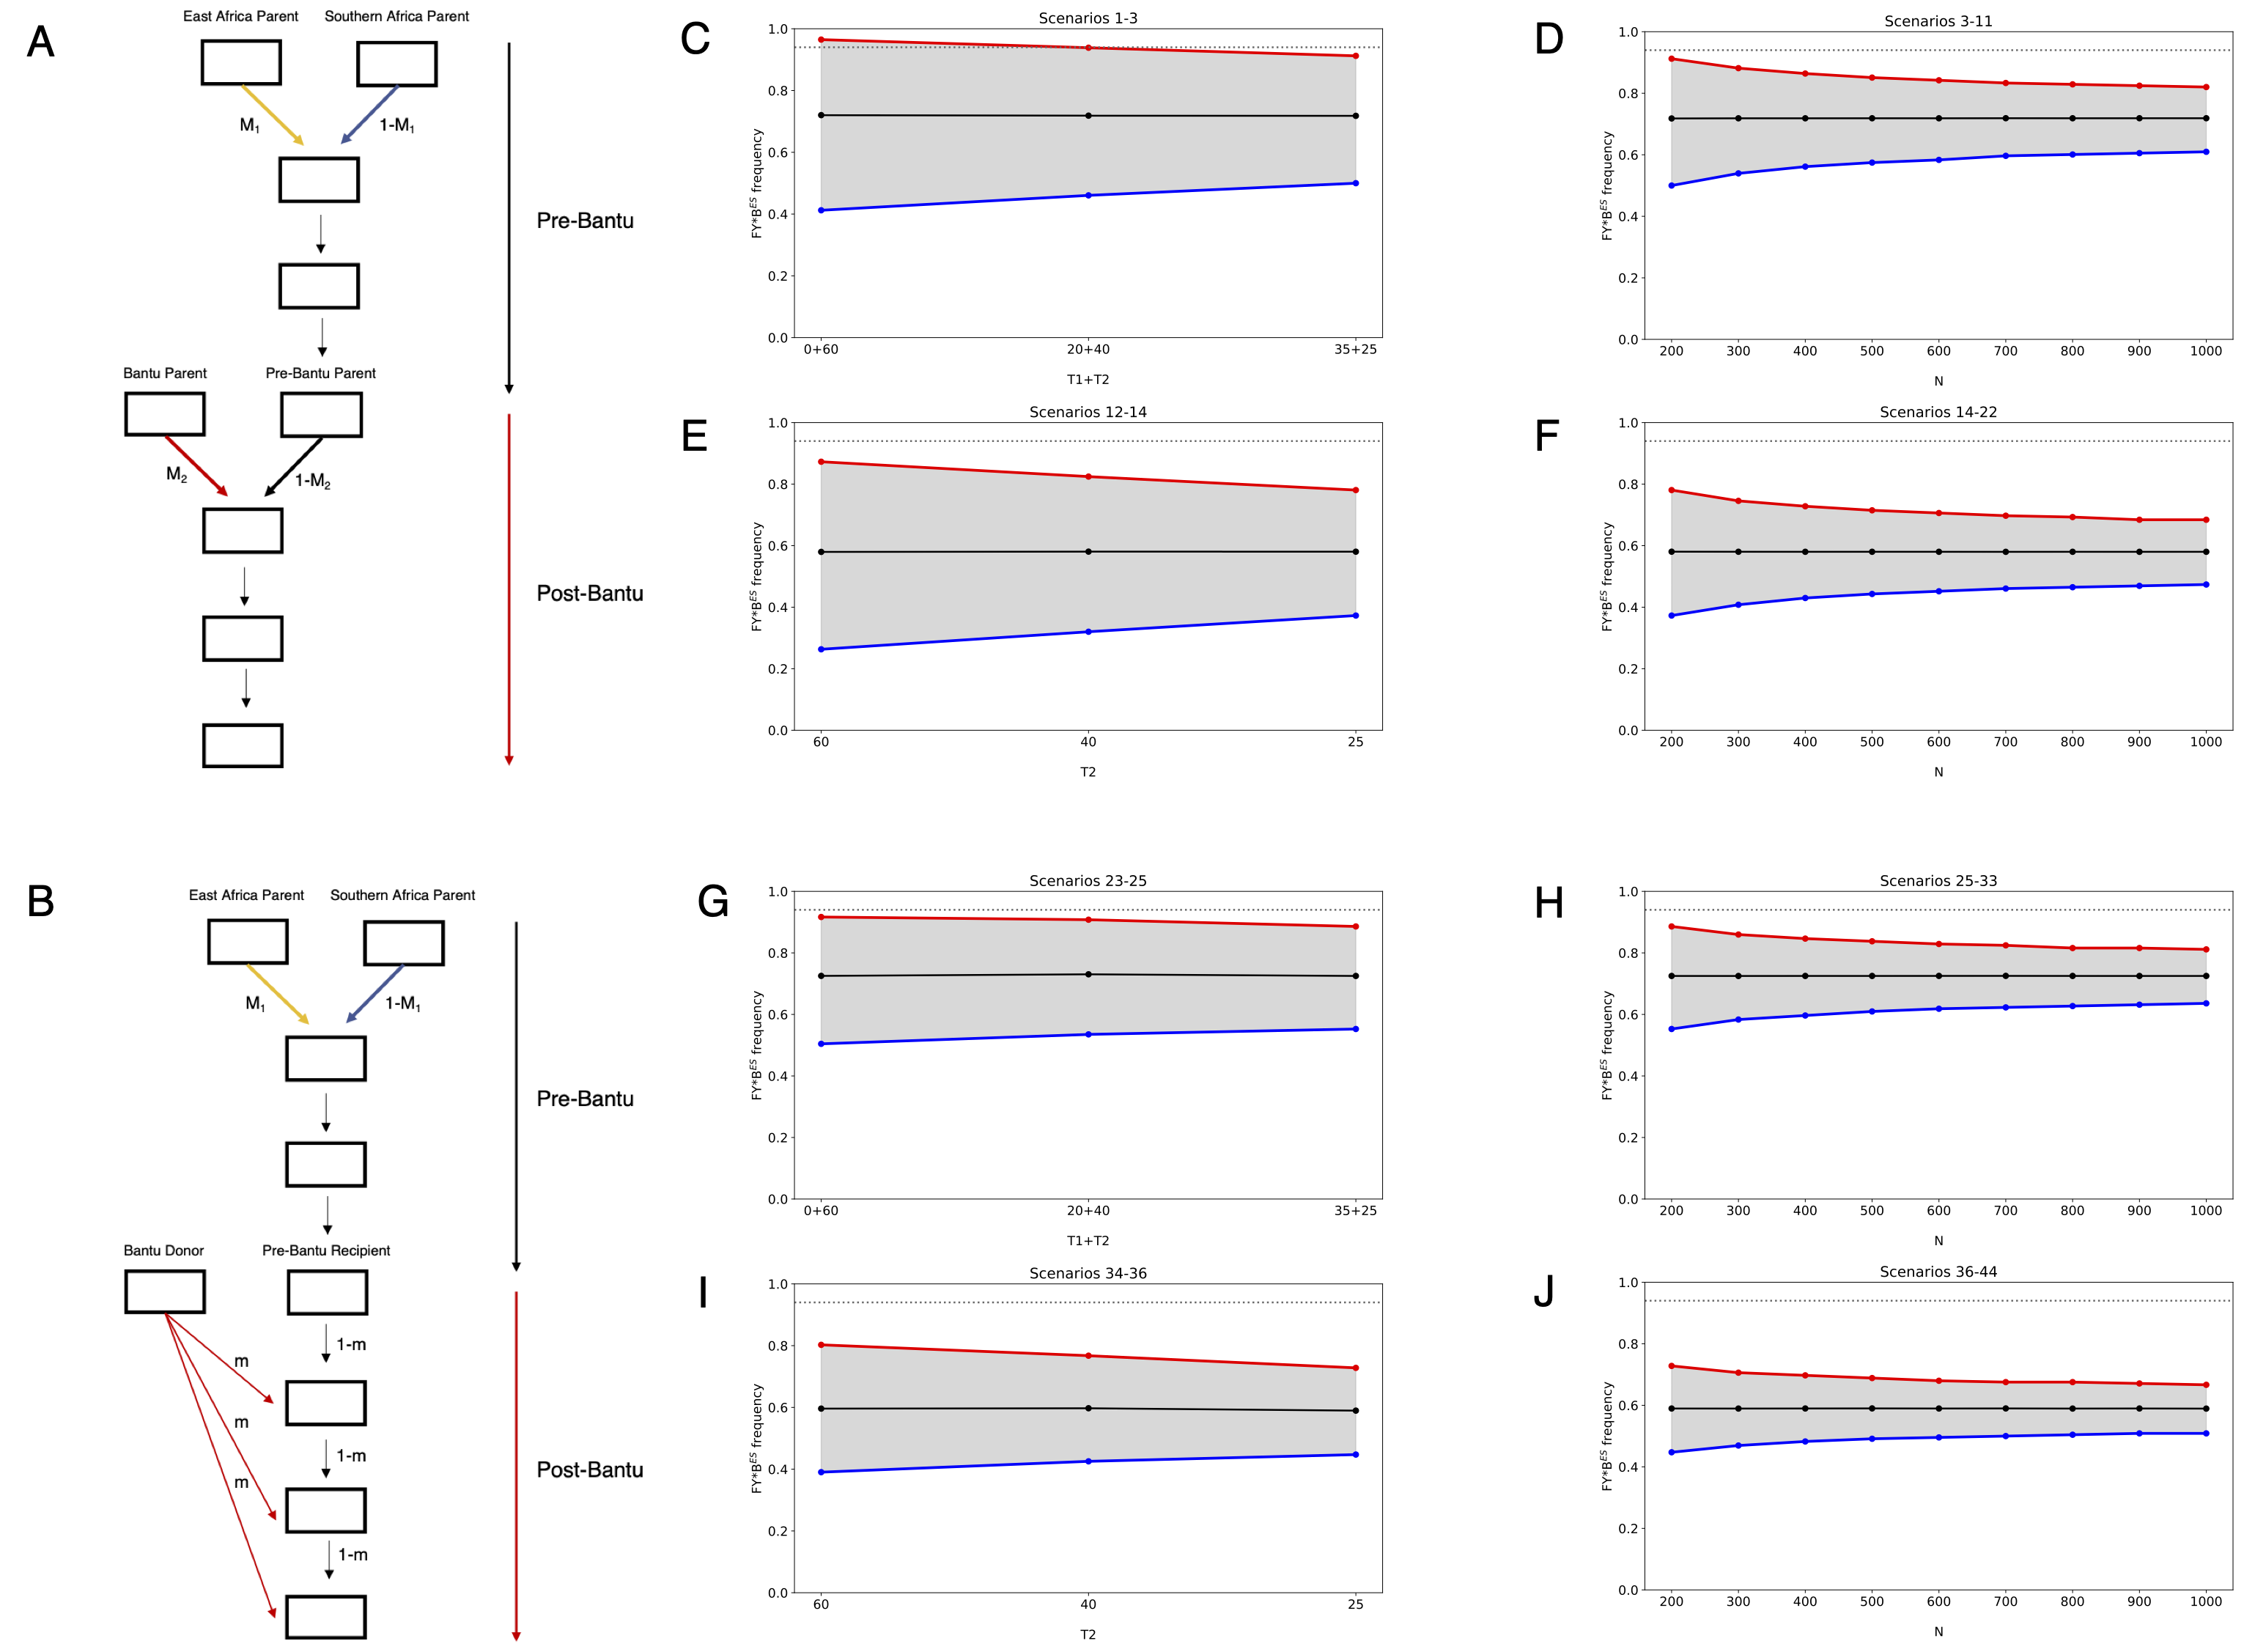
Figure 2. Simulations of admixture and genetic drift. Admixture models with two admixture pulses (A) and with one pulse followed by continuous gene flow (B). M1=East-African-related ancestry proportion; M2=Bantu-related ancestry proportion; m=migration rate from the Bantu donor population per generation; T1=number of generations between the first admixture pulse and the onset of Bantu admixture; T2=number of generations from Bantu admixture to present. (C-J) Distributions of simulated FY*BES allele frequencies in samples of 114 individuals, under different admixture models, with varying time intervals since admixture (T1 and T2), initial allele frequencies and population sizes (N), corresponding to scenarios outlined in Table S6: panels C-F refer to scenarios 1 to 22, and panels G-J refer to scenarios 23-44. In each panel, the dashed grey line indicates the observed allele frequency in the Khwe; the solid black line indicates the expected allele frequency; and the grey shaded area represents the 95% quantile of simulated allele frequencies.
After admixture, the ancestry of a source population carrying a beneficial allele is expected to become overrepresented in the genomic regions surrounding the advantageous variant [58,74].
To assess whether genomic segments containing the Duffy locus showed deviations from genome-wide ancestry proportions in the Khwe genomes, we inferred local ancestry while excluding the SNPs that determine Duffy allelic variation from the analysis.
Although local ancestry inference based on genotype array data may have reduced power to detect shorter ancestry tracts generated by older admixture events, we identified a 390 kb region on chromosome 1, encompassing the Duffy gene, where Bantu-related ancestry was significantly elevated (75%) compared to the genome-wide average (58%). This difference corresponds to 2.68 SD above the mean, placing the region in the 99th percentile of the genome-wide distribution of Bantu ancestry (Figure 3A and D; Table S7).
An opposite and stronger deviation was observed in the same genomic region for resident southern African-related ancestry (9,3 vs 30, 5%), corresponding to 3.79 SD below the mean (Figure 3B and E; Table S7).
The asymmetry between the two ancestry deviations appears to be driven by a non-significant local elevation of East African ancestry (Figure 3C and F; Table S7), which could reflect random noise or the presence of FY*BES linked markers in the Somali population.
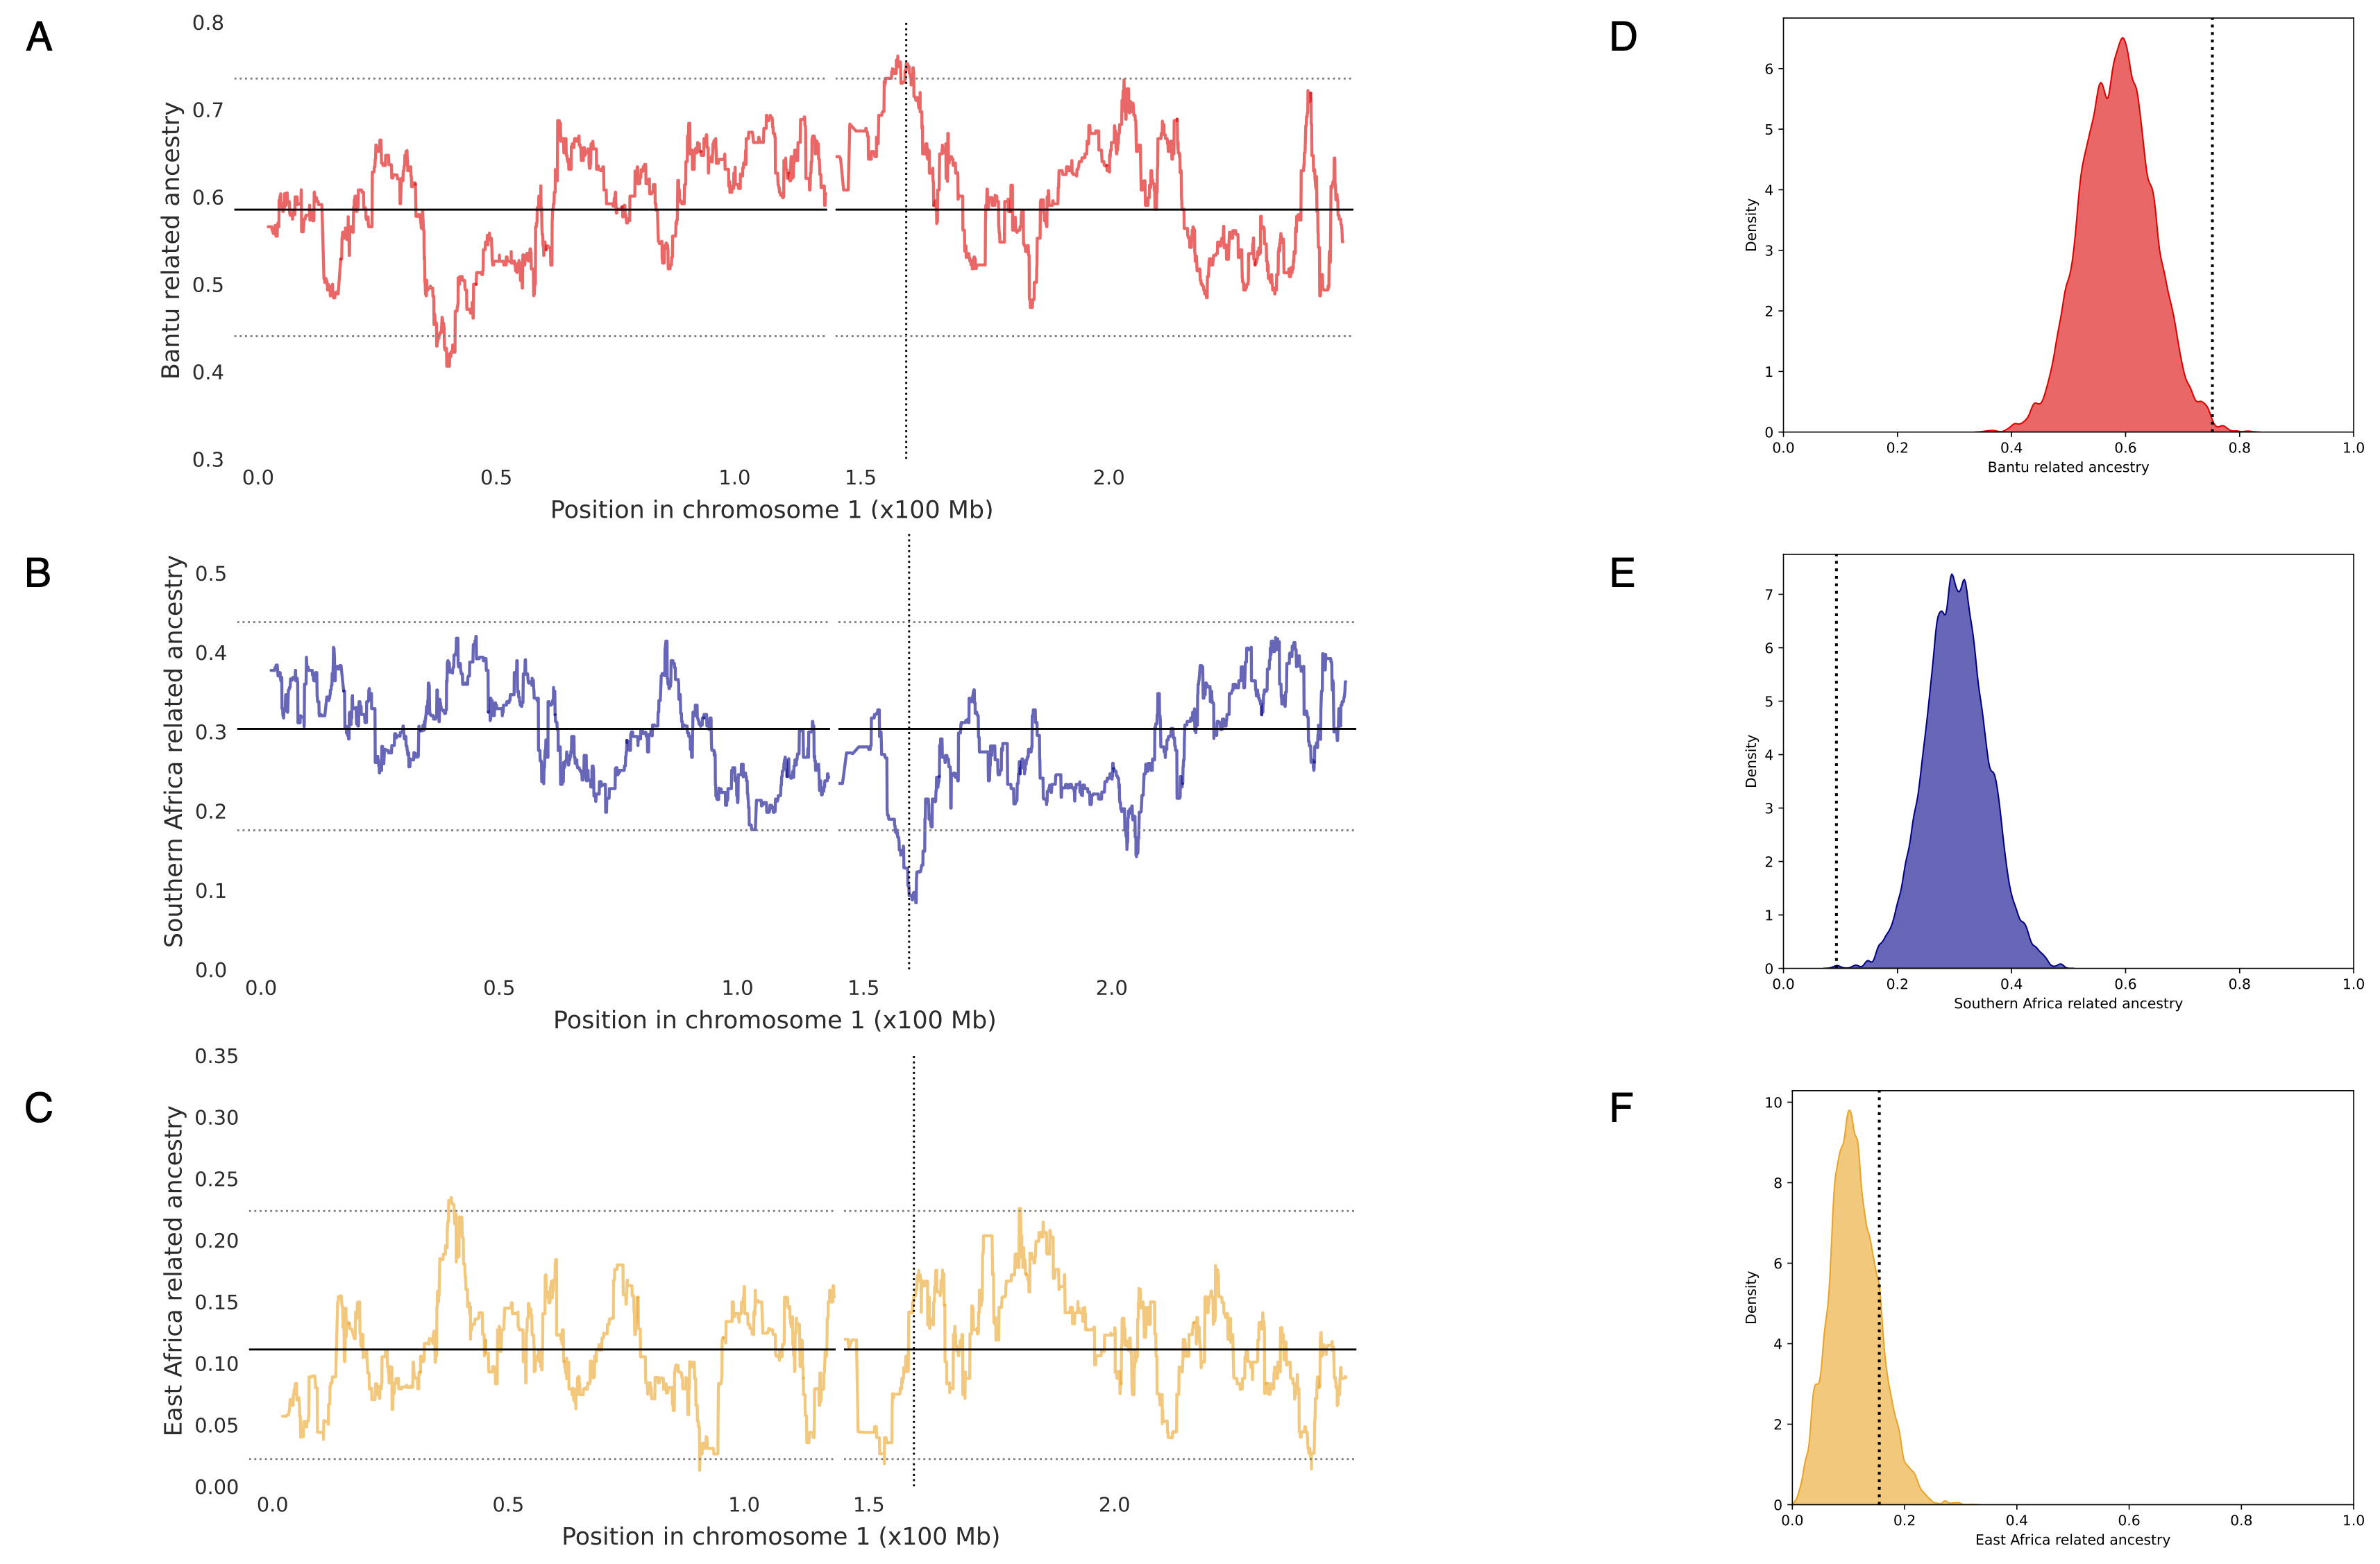
Figure 3. Local ancestry proportions along chromosome 1 and genome-wide distributions of local ancestry proportions in the Khwe. (A-C) Average local ancestry proportions in 114 Khwe individuals along chromosome 1 for Bantu (A), southern African (B), and eastern African-related (C) ancestries. Solid horizontal lines indicate genome-wide average ancestry proportions, while dashed horizontal lines correspond to the 99th and 1st percentiles of local ancestry distributions. Dashed vertical lines mark the position of the Duffy locus. (D–F) Genome-wide distributions of average Bantu (D), southern African (E), and eastern African-related (F) ancestry proportions. Dashed vertical lines indicate the local ancestry estimate for the RFMix window containing the Duffy locus. Kwangali, Juǀ’hoan and Somali were used as proxies for Bantu, southern African and eastern African-related ancestries, respectively. The Chromosome 1 region from position 119429575 to position 144929697 was excluded, due to the absence of markers on the Affymetrix Axiom Genome-Wide Human Origins Array. Coordinates are based on the GRCh37/hg19 version of the H. sapiens genome.
A similar excess of Bantu-related ancestry, accompanied by a reciprocal decrease in southern African-related ancestry, was observed when Hadza and Nyaneka populations were used as alternative eastern African and Bantu-related source populations, respectively (Figures S6-S8; Table S7). Moreover, both signals remained robust across different admixture times and phasing methods (Table S7).
Taken together, these results support the hypothesis that the FY*BES allele and its linked haplotypes underwent post-admixture positive selection in the Khwe, following the arrival of Bantu-speaking populations in the lower Okavango River Basin.
Additional genomic regions showing significant local ancestry deviations in at least three sets of source populations are listed in Table S8. Two regions displaying excess southern African–related ancestry contained genes associated with metabolic and lipid-related functions (e.g. ARL15 and LDLR), while one region with excess eastern African–related ancestry encompassed TMTC1, a gene involved in calcium homeostasis.
Finally, we applied a deterministic model assuming an infinite population size to estimate the selection coefficient (s) required to reach the observed FY*BES allele frequency. This analysis was based on the admixture scenario shown in Figure 2A, using different sets of initial allele frequencies and admixture times (Figure S9; Table S9).
Assuming that selection acts only on individuals homozygous for FY*BES (h = 1), the estimated selection coefficients in the Khwe ranged from 0.035 to 0.114. Under an additive model (h = 0.5), the estimated s values ranged from 0.059 to 0.179 (Figure S9; Table S9). We additionally estimated selection coefficients separately for ǁAni-Khwe and non-ǁAni-Khwe populations (Table S9). Inferred selection was consistently stronger in ǁAni-Khwe than in non-ǁAni-Khwe across the tested scenarios (h = 0.5: 0.11–0.30 vs. 0.05–0.16; h = 1: 0.06–0.17 vs. 0.03–0.11). This pattern may be consistent with ecological differences between the two groups, including the occupation of comparatively drier environments by non-ǁAni-Khwe populations.
Overall, our estimates are comparable to those reported in previous admixture studies in Madagascar and Cape Verde [22,23], suggesting that strong recent selection favours Duffy negativity in different epidemiological and ecological contexts.
The evolutionary relationship between Duffy-negativity and Plasmodium vivax has been extensively debated. Several lines of evidence have been invoked to support the hypothesis that the parasite was not the sole driver of Duffy-negativity. These include the relatively mild clinical course of vivax malaria compared to P. falciparum infection, the recently documented ability of P. vivax to infect Duffy-negative individuals, and the absence of widespread P. vivax–resistance variants in human populations historically exposed to the parasite across Eurasia [13,75–77].
On the other hand, recent studies suggest that the burden of P. vivax malaria has been historically underestimated, and available data indicate that Duffy-negativity continues to confer significant protection against infection [14,15,78]. Moreover, the discovery in Papua New Guinea of the rs2814778 T>C promoter mutation on the background of the FY*A allele suggests that parallel adaptation may be occurring in regions with high P. vivax endemicity [79]. Finally, a role of P. vivax resistance in driving the high frequency of the FY*BES allele is supported by evidence that post-admixture selection favours Duffy-negativity in regions where P. vivax prevalence is known to be historically high, but not in areas like southern Africa, where the parasite was long thought to be absent or only present at residual levels [58].
To our knowledge, the present study provides the first evidence of post-admixture selection favoring Duffy-negativity in the lower Okavango Basin— a region of southern Africa where P. vivax has only recently been documented using molecular approaches [26,29-31].
The implications of this finding critically depend on how long P. vivax has been present in the region. If the parasite lineages currently circulating among Duffy-negative individuals in Africa were newly adapted strains that were only recently introduced in the Okavango Basin, our results could suggest that P. vivax is not a selective force driving the rise in Duffy-negativity. However, since available evidence shows no clear genetic differences between strains infecting Duffy-negative and Duffy-positive individuals [32,80], it remains plausible that the circulating lineages are not newly emerged, but rather remnants of older parasite populations that were only partially suppressed by the rise in FY*BES frequency [81].
In this context, our observation that post-admixture selection has promoted the diffusion of the beneficial FY*BES allele from ancestral Bantu-speaking groups into the Khwe suggests that P. vivax could be circulating in the region at least 500 to 1,000 years ago, as implied by available estimates of the timing of admixture between Bantu incomers and the Khwe, as well as other pre-Bantu populations in southern Africa [36,37,61,62,73].
Due to regional variation in temperature and aridity, the historical spatial distribution of P. vivax endemicity in southern Africa was likely highly heterogeneous. While the Okavango Basin presently represents a marginal ecological setting for P. vivax transmission within southern Africa [27,28], available evidence suggests a broader historical distribution of P. vivax and associated signals of post-admixture selection.
In Botswana, recent active surveillance has also reported unexpectedly high P. vivax prevalence in districts south of the Okavango Delta [26]. Moreover, the frequency of the FY*BES allele (87.5%) observed in earlier serological studies among Khoe-Kwadi–speaking Shua individuals from the Nata River Valley [82] is substantially higher than expected based on their genome-wide Bantu ancestry estimates (43–49%) [36,37,65], suggesting that post admixture selection for Duffy negativity may also have occurred in this region.
In contrast, no evidence of post-admixture selection has been detected in other southern African populations, despite their contact with Bantu-speaking groups carrying the FY*BES allele [55,70,83]. This geographic contrast may reflect spatial differences in malaria exposure and environmental suitability for P. vivax transmission.
Further studies on post-admixture selection in resident groups that have interacted with populations from different streams of the Bantu expansions, across diverse ecological zones, will help refine our understanding of the spatial and temporal dynamics of the relationship between Duffy-negativity and P. vivax malaria in southern Africa.
The following supplementary materials are available on the website of this paper: HPGG2606020008SupplementaryMaterials.zip
Figure S1. Geographic locations of sampled Khwe-speaking individuals, together with Kwangali (this study) and Juǀ’hoan-speaking groups, which were used as proxies for parental populations.
Figure S2. Consensus tree of a Bayesian phylogenetic analysis of the Khoe-Kwadi language family under the Continuous Markov Chain Model.
Figure S3. Pairwise FST relationships among newly sampled and contextual populations.
Figure S4. Distributions of expected FY*BES (rs2814558*C) allele frequencies obtained by binomial resampling with 10⁶ replicates.
Figure S5. Genome-wide distributions of the Fadm statistic.
Figure S6. Local ancestry proportions along chromosome 1 and genome-wide distributions of local ancestry proportions in the Khwe, using Kwangali, Ju|’hoan, and Hadza as proxies for Bantu, southern African, and eastern African-related ancestries, respectively.
Figure S7. Local ancestry proportions along chromosome 1 and genome-wide distributions of local ancestry proportions in the Khwe, using Nyaneka, Ju|’hoan, and Somali as proxies for Bantu, southern African, and eastern African-related ancestries, respectively.
Figure S8. Local ancestry proportions along chromosome 1 and genome-wide distributions of local ancestry proportions in the Khwe, using Nyaneka, Ju|’hoan, and Hadza as proxies for Bantu, southern African, and eastern African-related ancestries, respectively.
Figure S9. Trajectories of FY*BES allele frequencies in the Khwe under the admixture scenarios described in Table S9, using the best-fitting selection coefficients (s), dominance coefficients (ℎ) of 0.5 and 1, and assuming an infinite population size.
Table S1. Newly sampled and contextual African populations included in this study.
Table S2. Estimates of ancestry proportions in the Khwe.
Table S3. Distribution of Duffy genotypes and phenotypes in samples from the present study.
Table S4. FY*BES allele frequencies.
Table S5. Expected FY*BES frequencies under neutrality in the Khwe, including ancestry proportion estimates available in the literature.
Table S6. Simulation scenarios used to generate distributions of expected FY*BES frequencies under admixture and genetic drift.
Table S7. Local ancestry deviations around the FY*BES allele (chr1:159174683) using different phasing methods, admixture times and ancestry panels.
Table S8. Genomic regions showing local ancestry deviations (±3 SD) across the genome in at least three of the four ancestry panels analyzed.
Table S9. Estimated selection coefficients under different admixture scenarios, assuming infinite population size.
The study involved the collection of saliva samples and ethnolinguistic information from adult volunteers. The study was approved and authorized by the Ministry of Health and Social Services of Namibia (Permit No. RPIV00722019) and Botswana (Permit No. HPRD: 6/14/1) in accordance with local regulatory requirements. All participants were informed about the study in their native language through a bilingual translator, and written informed consent was obtained prior to sample collection.
Not applicable.
The genotype data from 114 Khwe individuals and 35 Kwangali individuals may be obtained from the corresponding author on reasonable request. The code is available on GitHub (https://github.com/ArtemKasianov/DuffyPaper).
This work was supported by the Portuguese Foundation for Science and Technology (FCT) [grant numbers PTDC/BIA-GEN/29273/2017, 2022.06259.PTDC, CEECIND/02765/2017].
Jorge Rocha is a member of the Editorial Board of the journal Human Population Genetics and Genomics. The author was not involved in the journal’s review of or decisions related to this manuscript. The authors have declared that no other competing interests exist.
Conceptualization: A-M.F., M.B., G.M., E.C.F. and J.R.; Methodology: A.K. and J.R.; Software: A.K.; Formal Analysis: A.K.; Investigation: A-M.F., M.B., G.M., E.C.F. and J.R.; Writing – Original Draft: J.R.; Visualization: A.K. and A-M.F.; Project Administration: J.R.; Funding Acquisition: J.R. and A-M.F.
This study would not have been possible without the administrative and logistic support of the TwinLabs established between BIOPOLIS-CIBIO and the Universities of Namibia and Botswana. We further extend our gratitude to the Ministries of Health of the governments of Namibia and Botswana for granting us research permits, as well as to the local authorities and institutions that supported our fieldwork. We specifically wish to acknowledge the Teemashani Trust representing the ǁAni-Khwe community at Mohembo (North-West District, Botswana), as well as Thaddeus Chedau, Mmoloki Mogomotsi, and Kelatlhilwe Gamaxo Moses who assisted us during the data collection. Finally, we thank Mark Stoneking for comments and suggestions on a previous version of this manuscript.
| 1. |
Miller LH, Mason SJ, Clyde DF, McGinniss MH. The resistance factor to |
| 2. |
Barnwell JW, Nichols ME, Rubinstein P. In vitro evaluation of the role of the Duffy blood group in erythrocyte invasion by |
| 3. | Neote K, Mak JY, Kolakowski LF Jr, Schall TJ. Functional and biochemical analysis of the cloned Duffy antigen: identity with the red blood cell chemokine receptor. Blood. 1994;84(1):44-52. [Google Scholar] [CrossRef] |
| 4. | Zimmerman PA. The enigma of Plasmodium vivax malaria and erythrocyte Duffy negativity. In: Dronamraju KR, editor. Infectious Disease and Host Pathogen Evolution. Cambridge: Cambridge University Press; 2004. p.141-172. [CrossRef] |
| 5. | Bachelerie F, Ben-Baruch A, Burkhardt AM, Combadiere C, Farber JM, Graham GJ, et al. International Union of Basic and Clinical Pharmacology. LXXXIX. Update on the extended family of chemokine receptors and introducing a new nomenclature for atypical chemokine receptors. Pharmacol Rev. 2014;66(1):1-79. [Google Scholar] [CrossRef] |
| 6. | Chaudhuri A, Polyakova J, Zbrzezna V, Pogo AO. The coding sequence of Duffy blood group gene in humans and simians: restriction fragment length polymorphism, antibody and malarial parasite specificities, and expression in nonerythroid tissues in Duffy-negative individuals. Blood. 1995;85(3):615-621. [Google Scholar] [CrossRef] |
| 7. | Tournamille C, Colin Y, Cartron JP, Le Van Kim C. Disruption of a GATA motif in the Duffy gene promoter abolishes erythroid gene expression in Duffy-negative individuals. Nat Genet. 1995;10(2):224-228. [Google Scholar] [CrossRef] |
| 8. | Tournamille C, Le Van Kim C, Gane P, Cartron JP, Colin Y. Molecular basis and PCR-DNA typing of the Fya/Fyb blood group polymorphism. Hum Genet. 1995;95(4):407-410. [Google Scholar] [CrossRef] |
| 9. | Howes RE, Patil AP, Piel FB, Nyangiri OA, Kabaria CW, Gething PW, et al. The global distribution of the Duffy blood group. Nat Commun. 2011;2:266. [Google Scholar] [CrossRef] |
| 10. | Carter R, Mendis KN. Evolutionary and historical aspects of the burden of malaria. Clin Microbiol Rev. 2002;15(4):564-594. [Google Scholar] [CrossRef] |
| 11. | Hedrick PW. Population genetics of malaria resistance in humans. Heredity. 2011;107(4):283-304. [Google Scholar] [CrossRef] |
| 12. |
Rosenberg R. |
| 13. |
Howes RE, Reiner RC Jr, Battle KE, Longbottom J, Mappin B, Ordanovich D, et al. |
| 14. |
Twohig KA, Pfeffer DA, Baird JK, Price RN, Zimmerman PA, Hay SI, et al. Growing evidence of |
| 15. |
Wilairatana P, Masangkay FR, Kotepui KU, De Jesus Milanez G, Kotepui M. Prevalence and risk of |
| 16. | Abate A, Bouyssou I, Mabilotte S, Doderer-Lang C, Dembele L, Menard D, et al. Vivax malaria in Duffy-negative patients shows invariably low asexual parasitaemia: implication towards malaria control in Ethiopia. Malar J. 2022;21(1):230. [Google Scholar] [CrossRef] |
| 17. |
Bradley L, Yewhalaw D, Hemming-Schroeder E, Jeang B, Lee MC, Zemene E, et al. Epidemiology of |
| 18. |
Gunalan K, Niangaly A, Thera MA, Doumbo OK, Miller LH. |
| 19. | Hodgson JA, Pickrell JK, Pearson LN, Quillen EE, Prista A, Rocha J, et al. Natural selection for the Duffy-null allele in the recently admixed people of Madagascar. Proc Biol Sci. 2014;281(1789):20140930. [Google Scholar] [CrossRef] |
| 20. | Triska P, Soares P, Patin E, Fernandes V, Cerny V, Pereira L. Extensive admixture and selective pressure across the Sahel belt. Genome Biol Evol. 2015;7(12):3484-3495. [Google Scholar] [CrossRef] |
| 21. | Laso-Jadart R, Harmant C, Quach H, Zidane N, Tyler-Smith C, Mehdi Q, et al. The genetic legacy of the Indian Ocean slave trade: recent admixture and post-admixture selection in the Makranis of Pakistan. Am J Hum Genet. 2017;101(6):977-984. [Google Scholar] [CrossRef] |
| 22. | Pierron D, Heiske M, Razafindrazaka H, Pereda-Loth V, Sanchez JJ, Alva O, et al. Strong selection during the last millennium for African ancestry in the admixed population of Madagascar. Nat Commun. 2018;9(1):932. [Google Scholar] [CrossRef] |
| 23. | Hamid I, Korunes KL, Beleza S, Goldberg A. Rapid adaptation to malaria facilitated by admixture in the human population of Cabo Verde. eLife. 2021;10:e63177. [Google Scholar] [CrossRef] |
| 24. | Vilà-Valls L, Garcia-Calleja J, Prado-Martinez J, Bosch E, Andrés AM, Netea MG, et al. Sudan's complex genetic admixture history drives adaptation to malaria in Sudanese Copts. Proc Natl Acad Sci U S A. 2026;123(3):e2516263123. [Google Scholar] [CrossRef] |
| 25. |
Haffener PE, Al-Riyami AZ, Al-Zadjali S, Busby GBJ, Al-Mahdhuri S, Al-Rawahi M, et al. Adaptive admixture at ACKR1, the Duffy blood group locus, may have shaped |
| 26. |
Quaye IK, Aleksenko L, Paganotti GM, Peloewetse E, Haiyambo DH, Ntebela D, et al. Malaria elimination in Africa: rethinking strategies for |
| 27. |
Gething PW, Van Boeckel TP, Smith DL, Guerra CA, Patil AP, Snow RW, et al. Modelling the global constraints of temperature on transmission of |
| 28. |
Weiss DJ, Dzianach PA, Saddler A, Lubinda J, Browne AJ, McPhail M, et al. Mapping the global prevalence, incidence, and mortality of |
| 29. | Bango ZA, Tawe L, Muthoga CW, Paganotti GM. Past and current biological factors affecting malaria in the low transmission setting of Botswana: a review. Infect Genet Evol. 2020;85:104458. [Google Scholar] [CrossRef] |
| 30. |
Motshoge T, Ababio GK, Aleksenko L, Read J, Peloewetse E, Loeto M, et al. Molecular evidence of high rates of asymptomatic |
| 31. |
Motshoge T, Haiyambo DH, Ayanful-Torgby R, Aleksenko L, Ntebela D, Malleret B, et al. Recent molecular assessment of |
| 32. |
Lo E, Russo G, Pestana K, Kepple D, Abagero BR, Dongho GBD, et al. Contrasting epidemiology and genetic variation of |
| 33. | Schlebusch CM, Jakobsson M. Tales of human migration, admixture, and selection in Africa. Annu Rev Genomics Hum Genet. 2018;19:405-428. [Google Scholar] [CrossRef] |
| 34. | Pakendorf B, Stoneking M. The genomic prehistory of peoples speaking Khoisan languages. Hum Mol Genet. 2021;30(R1):R49-R55. [Google Scholar] [CrossRef] |
| 35. | Fehn AM, Amorim B, Rocha J. The linguistic and genetic landscape of southern Africa. J Anthropol Sci. 2022;100:243-265. [Google Scholar] [CrossRef] |
| 36. | Pickrell JK, Patterson N, Loh PR, Lipson M, Berger B, Stoneking M, et al. Ancient west Eurasian ancestry in southern and eastern Africa. Proc Natl Acad Sci U S A. 2014;111(7):2632-2637. [Google Scholar] [CrossRef] |
| 37. | Oliveira S, Fehn AM, Amorim B, Stoneking M, Rocha J. Genome-wide variation in the Angolan Namib desert reveals unique pre-Bantu ancestry. Sci Adv. 2023;9(38):eadh3822. [Google Scholar] [CrossRef] |
| 38. | Vossen R. Die Khoe-Sprachen: ein Beitrag zur Erforschung der Sprachgeschichte Afrikas. Cologne: Rüdiger Köppe; 1997. [Google Scholar] |
| 39. | Brenzinger M. In: Witzlack-Makarevich A, Ernszt M, editors. Khoisan languages and linguistics: Proceedings of the 3rd international symposium. Cologne: Rüdiger Köppe; 2013. p.139-161. . 2013. p.139-161. [Google Scholar] |
| 40. | Fehn AM. Phonological and lexical variation in the Khwe dialect cluster. Z Dtsch Morgenl Ges. 2019;169(1):9-38. [Google Scholar] [CrossRef] |
| 41. | McGurk C, Gibson GD. In: Gibson GD, Larson TJ, McGurk CR, editors. The Kavango Peoples. Wiesbaden: Franz Steiner; 1981. p.35-80. . 1981. p.35-80. [Google Scholar] |
| 42. | Patterson N, Moorjani P, Luo Y, Mallick S, Rohland N, Zhan Y, et al. Ancient admixture in human history. Genetics. 2012;192(3):1065-1093. [Google Scholar] [CrossRef] |
| 43. | Chang CC, Chow CC, Tellier LC, Vattikuti S, Purcell SM, Lee JJ. Second-generation PLINK: rising to the challenge of larger and richer datasets. Gigascience. 2015;4:7. [Google Scholar] [CrossRef] |
| 44. | Browning BL, Tian X, Zhou Y, Browning SR. Fast two-stage phasing of large-scale sequence data. Am J Hum Genet. 2021;108(10):1880-1890. [Google Scholar] [CrossRef] |
| 45. | Delaneau O, Marchini J, Zagury JF. A linear complexity phasing method for thousands of genomes. Nat Methods. 2011;9(2):179-181. [Google Scholar] [CrossRef] |
| 46. | Patterson N, Price AL, Reich D. Population structure and eigenanalysis. PLoS Genet. 2006;2(12):e190. [Google Scholar] [CrossRef] |
| 47. | Price AL, Patterson NJ, Plenge RM, Weinblatt ME, Shadick NA, Reich D. Principal components analysis corrects for stratification in genome-wide association studies. Nat Genet. 2006;38(8):904-909. [Google Scholar] [CrossRef] |
| 48. | R Core Team. R: a language and environment for statistical computing [Internet]. Vienna: R Foundation for Statistical Computing; 2026 [cited 2026 May 22]. Available from: https://www.R-project.org/. [Google Scholar] |
| 49. | Paradis E, Schliep K. ape 5.0: an environment for modern phylogenetics and evolutionary analyses in R. Bioinformatics. 2019;35(3):526-528. [Google Scholar] [CrossRef] |
| 50. | Kolde R. pheatmap: pretty heatmaps. R package version 1.0.13 [Internet]; 2025 [cited 2026 May 22]. Available from: https://github.com/raivokolde/pheatmap. [Google Scholar] |
| 51. | Maples BK, Gravel S, Kenny EE, Bustamante CD. RFMix: a discriminative modeling approach for rapid and robust local-ancestry inference. Am J Hum Genet. 2013;93(2):278-288. [Google Scholar] [CrossRef] |
| 52. | Tishkoff SA, Reed FA, Friedlaender FR, Ehret C, Ranciaro A, Froment A, et al. The genetic structure and history of Africans and African Americans. Science. 2009;324(5930):1035-1044. [Google Scholar] [CrossRef] |
| 53. | Henn BM, Gignoux CR, Jobin M, Granka JM, Macpherson JM, Kidd JM, et al. Hunter-gatherer genomic diversity suggests a southern African origin for modern humans. Proc Natl Acad Sci U S A. 2011;108(13):5154-5162. [Google Scholar] [CrossRef] |
| 54. | Bhatia G, Tandon A, Patterson N, Aldrich MC, Ambrosone CB, Amos C, et al. Genome-wide scan of 29,141 African Americans finds no evidence of directional selection since admixture. Am J Hum Genet. 2014;95(4):437-444. [Google Scholar] [CrossRef] |
| 55. | Patin E, Lopez M, Grollemund R, Verdu P, Harmant C, Quach H, et al. Dispersals and genetic adaptation of Bantu-speaking populations in Africa and North America. Science. 2017;356(6337):543-546. [Google Scholar] [CrossRef] |
| 56. | Honorato-Mauer J, Shah NN, Maihofer AX, Zai CC, Belangero S, Nievergelt CM, et al. Characterizing features affecting local ancestry inference performance in admixed populations. Am J Hum Genet. 2025;112(2):224-234. [Google Scholar] [CrossRef] |
| 57. | Bernstein F. In: Comitato Italiano per lo Studio dei Problemi della Popolazione, editor. Roma: Istituto Poligrafico dello Stato; 1931. p.227-243. . 1931. p.227-243. [Google Scholar] |
| 58. | Cuadros-Espinoza S, Laval G, Quintana-Murci L, Patin E. The genomic signatures of natural selection in admixed human populations. Am J Hum Genet. 2022;109(4):710-726. [Google Scholar] [CrossRef] |
| 59. | Coop G. Population and quantitative genetics. GitHub release v1.2 [Internet]; 2020 [cited 2026 May 22]. Available from: https://github.com/cooplab/popgen-notes/releases/download/v1.2/minicoop.pdf. [Google Scholar] |
| 60. | Fenner JN. Cross-cultural estimation of the human generation interval for use in genetics-based population divergence studies. Am J Phys Anthropol. 2005;128(2):415-423. [Google Scholar] [CrossRef] |
| 61. | Vicente M, Lankheet I, Russell T, Hollfelder N, Coetzee V, Soodyall H, et al. Male-biased migration from East Africa introduced pastoralism into southern Africa. BMC Biol. 2021;19(1):259. [Google Scholar] [CrossRef] |
| 62. | Fortes-Lima CA, Burgarella C, Hammarén R, Eriksson A, Vicente M, Jolly C, et al. The genetic legacy of the expansion of Bantu-speaking peoples in Africa. Nature. 2024;625(7995):540-547. [Google Scholar] [CrossRef] |
| 63. | Montinaro F, Busby GBJ, Gonzalez-Santos M, Oosthuitzen O, Oosthuitzen E, Anagnostou P, et al. Complex ancient genetic structure and cultural transitions in southern African populations. Genetics. 2017;205(1):303-316. [Google Scholar] [CrossRef] |
| 64. | Köhler ORA. Die Welt der Kxoé-Buschleute im südlichen Afrika: eine Selbstdarstellung in ihrer eigenen Sprache. Berlin: Dietrich Reimer; 1989. [Google Scholar] |
| 65. | Skoglund P, Thompson JC, Prendergast ME, Mittnik A, Sirak K, Hajdinjak M, et al. Reconstructing prehistoric African population structure. Cell. 2017;171(1):59-71.e21. [Google Scholar] [CrossRef] |
| 66. | Long JC. The genetic structure of admixed populations. Genetics. 1991;127(2):417-428. [Google Scholar] [CrossRef] |
| 67. | Sistonen P, Koistinen J, Aden Abdulle O. Distribution of blood groups in the East African Somali population. Hum Hered. 1987;37(5):300-313. [Google Scholar] [CrossRef] |
| 68. |
Petersen E, Severini C, Picot S. |
| 69. | Vicente M, Jakobsson M, Ebbesen P, Schlebusch CM. Genetic affinities among southern African hunter-gatherers and the impact of admixing farmer and herder populations. Mol Biol Evol. 2019;36(9):1849-1861. [Google Scholar] [CrossRef] |
| 70. | McManus KF, Taravella AM, Henn BM, Bustamante CD, Sikora M, Cornejo OE. Population genetic analysis of the DARC locus (Duffy) reveals adaptation from standing variation associated with malaria resistance in humans. PLoS Genet. 2017;13(3):e1006560. [Google Scholar] [CrossRef] |
| 71. | Rajeevan H, Soundararajan U, Kidd JR, Pakstis AJ, Kidd KK. ALFRED: an allele frequency resource for research and teaching. Nucleic Acids Res. 2012;40(D1):D1010-D1015. [Google Scholar] [CrossRef] |
| 72. | Semo A, Gayà-Vidal M, Fortes-Lima C, Alard B, Oliveira S, Almeida J, et al. Along the Indian Ocean coast: genomic variation in Mozambique provides new insights into the Bantu expansion. Mol Biol Evol. 2020;37(2):406-416. [Google Scholar] [CrossRef] |
| 73. | Busby GBJ, Band G, Si Le Q, Jallow M, Bougama E, Mangano VD, et al. Admixture into and within sub-Saharan Africa. eLife. 2016;5:e15266. [Google Scholar] [CrossRef] |
| 74. | Gopalan S, Berl REW, Myrick JW, Garfield ZH, Reynolds AW, Bafens BK, et al. Hunter-gatherer genomes reveal diverse demographic trajectories during the rise of farming in eastern Africa. Curr Biol. 2022;32(8):1852-1860.e5. [Google Scholar] [CrossRef] |
| 75. | Livingstone FB. The Duffy blood groups, vivax malaria, and malaria selection in human populations: a review. Hum Biol. 1984;56(3):413-425. [Google Scholar] |
| 76. |
Baird JK. Neglect of |
| 77. | Roche B, Rougeron V, Quintana-Murci L, Renaud F, Abbate JL, Prugnolle F. Might interspecific interactions between pathogens drive host evolution? The case of Plasmodium species and Duffy-negativity in human populations. Trends Parasitol. 2017;33(1):21-29. [Google Scholar] [CrossRef] |
| 78. |
Baird JK. African |
| 79. |
Zimmerman PA, Woolley I, Masinde GL, Miller SM, McNamara DT, Hazlett F, et al. Emergence of FY*A(null) in a |
| 80. |
Kepple D, Hubbard A, Ali MM, Abargero BR, Lopez K, Pestana K, et al. |
| 81. |
Sharp PM, Plenderleith LJ, Culleton RL, Hahn BH. Origin of the human malaria parasite |
| 82. | Chasko WJ, Nurse GT, Harpending HC, Jenkins T. Sero-genetic studies on the 'Masarwa' of northeastern Botswana. Botsw Notes Rec. 1979;11:15-23. [Google Scholar] |
| 83. | Schlebusch CM, Skoglund P, Sjödin P, Gattepaille LM, Hernandez D, Jay F, et al. Genomic variation in seven Khoe-San groups reveals adaptation and complex African history. Science. 2012;338(6105):374-379. [Google Scholar] [CrossRef] |

![]()
Copyright © 2026 Pivot Science Publications Corp. - unless otherwise stated | Terms and Conditions | Privacy Policy


