
Green Energy and Sustainability ISSN 2771-1641
Green Energy and Sustainability 2025;5(4):0010 | https://doi.org/10.47248/ges2505040010
Original Research Open Access
Design and performance investigation of a solar photovoltaic installation on a university building
Evangelos Vidalis
1

 ,
Evangelos Bellos
2
,
Christos Sammoutos
1
,
Angeliki Kitsopoulou
1
,
Panagiotis Lykas
1
,
Dimitrios N. Korres
1
,
Dimitra Gonidaki
2
,
Christos Tzivanidis
1
,
Evangelos Bellos
2
,
Christos Sammoutos
1
,
Angeliki Kitsopoulou
1
,
Panagiotis Lykas
1
,
Dimitrios N. Korres
1
,
Dimitra Gonidaki
2
,
Christos Tzivanidis
1
Correspondence: Evangelos Vidalis
Academic Editor(s): Tony Roskilly, Georgios Martinopoulos, Georgia Kastrinaki, Hande Eryilmaz, Martin Roeb
Received: Aug 7, 2025 | Accepted: Nov 14, 2025 | Published: Nov 21, 2025
This article belongs to the Special Issue Selected Papers from the Conference ICRES 2025
© 2025 by the author(s). This is an Open Access article distributed under the Creative Commons License Attribution 4.0 International (CC BY 4.0) license, which permits unrestricted use, distribution and reproduction in any medium or format, provided the original work is correctly credited.
Cite this article: Vidalis E, Bellos E, Sammoutos C, Kitsopoulou A, Lykas P, Korres DN, Gonidaki D, Tzivanidis C. Design and performance investigation of a solar photovoltaic installation on a university building. Green Energy Sustain. 2025;5(4):0010. https://doi.org/10.47248/ges2505040010
As the fraction of global energy consumption derived from renewable energy sources continues to increase, solar energy is the one among the others with the largest growth in usage. Despite its advantages, which include cost-effectiveness and the ability to be used in a wide range of applications, there are some factors that play a significant role in the total energy production of a photovoltaic system. Some of them are the tilt and orientation of the solar panels and the shadows generated. This work aims to conduct simulations of photovoltaic systems to be installed on a building of the laboratories of Mechanical Engineering at the Polytechnic Campus of the National Technical University of Athens. The building is characterized by a gross rooftop area of about 2000 m2. In this study, the Skelion software, a plugin in the environment of Sketchup, is used. Initially, using the dimensions of the building based on the calculation from three-dimensional rendering maps from Google Earth, as well as observation and measurement of dimensions on-site, the design of the building and the surrounding area is completed. Subsequently, an analysis of certain parameters is carried out, such as the type of photovoltaic panel, the shading on the surfaces, and the optimal tilt and orientation of the panels, aiming at the optimal utilization of solar energy potential. In addition to the above, certain scenarios for the placement of photovoltaic panels both on the roof of the building and on its sides are examined. Lastly, based on the results, an economic analysis and comparison are carried out to find the system with the optimal energy performance that will be as profitable as possible. As a result, the maximum annual energy production, in accordance with the acceptable energy efficiency of the solar panels, was found to be 247 MWh, with the maximum rate of losses due to shading being equal to 10%. Furthermore, the net present value of the specific scenario rises to 20 k€ and the payback period was calculated to be 10 years.
KeywordsPhotovoltaics, Solar Systems, Shadowing effects, Shadow trajectories, Installation methods
In recent years, both the energy crisis and climate change have become some of the most critical issues whose mitigation is considered essential. During the latest decades, several factors such as the increase in energy demand, geopolitical tensions, disruptions in supply chains, the growing urgency surrounding climate change, and others led to the energy crisis, which forced Europe and many other countries to strategically increase the use of renewable energy in order to reduce the utilization of fossil energy [1-4]. One of the most promising solutions among renewable energy sources is proved to be solar energy, which can be harnessed in two primary ways: solar thermal systems and photovoltaic (PV) systems. While solar thermal systems use solar energy to heat water or air or some other heat transfer fluids, for direct use or later exploitation, the PV systems capture solar energy for delivering electricity with the use of semiconductor materials. Despite their disadvantages, which mainly include the relatively low efficiency and the large areas required for installation, the technological improvements in recent years have made them the technology with the largest share of new additions. The total global installed capacity of photovoltaic systems at the end of 2023 surpassed 1.3 TW, with the largest proportion of these installations located in Asia, particularly in China [5]. However, the efficiency of photovoltaic systems depends on several environmental and technical factors affecting the available solar radiation. For the maximization of efficiency through the selection of the best possible installation parameters such as tilt and orientation angle is of high importance. Thus, simulating scenarios before the installation plays an essential role. In the literature, there is some research conducted referring to photovoltaic systems simulations. Pons et al. (2016) [6] modeled a photovoltaic system installed in an urban area in Marrakech, whereas Tian et al. (2024) [7] used an innovative method for evaluating the urban roof photovoltaic potential based on open-source satellite images. Additionally, Zhu et al. (2023) [8] performed analyses for rooftop PV installations on multiple university campuses in China and Aktas et al. (2024) [9] performed a technoeconomic analysis of college rooftop for grid-connected PV power generation for a campus in Turkey, using PVsyst.
In this direction, this study examines the performance of a photovoltaic system installed on the roof of a university building, including a detailed shadowing analysis and calculation of installation parameters like tilt and orientation factors. The analysis is conducted through the combined use of tools within the SketchUp and Skelion environment, enabling integrated 3D shadow simulation, spatial layout planning, energy yield estimation, and financial evaluation under different scenarios. This methodology provides a practical and adaptable framework for PV system assessment under realistic design and economic conditions.
In the present section, the basic parameters concerning the university building and the photovoltaic panels are discussed. Additionally, the simulation parameters as well as the mathematical modelling for the simulation process are also presented.
The building examined in the present analysis is a university building of the National Technical University of Athens (longitude: 23.78°, latitude: 37.97°). It was designed in the environment of SketchUp, based on the calculation of dimensions from three-dimensional rendering maps from Google Earth, as well as observation and measurements of dimensions on-site. The building has an available rooftop area of approximately 2000 m2. The basic building dimensions are presented in Table 1, and the designed building is shown in Figure 1.
Table 1 Basic dimensions of the designed university building.


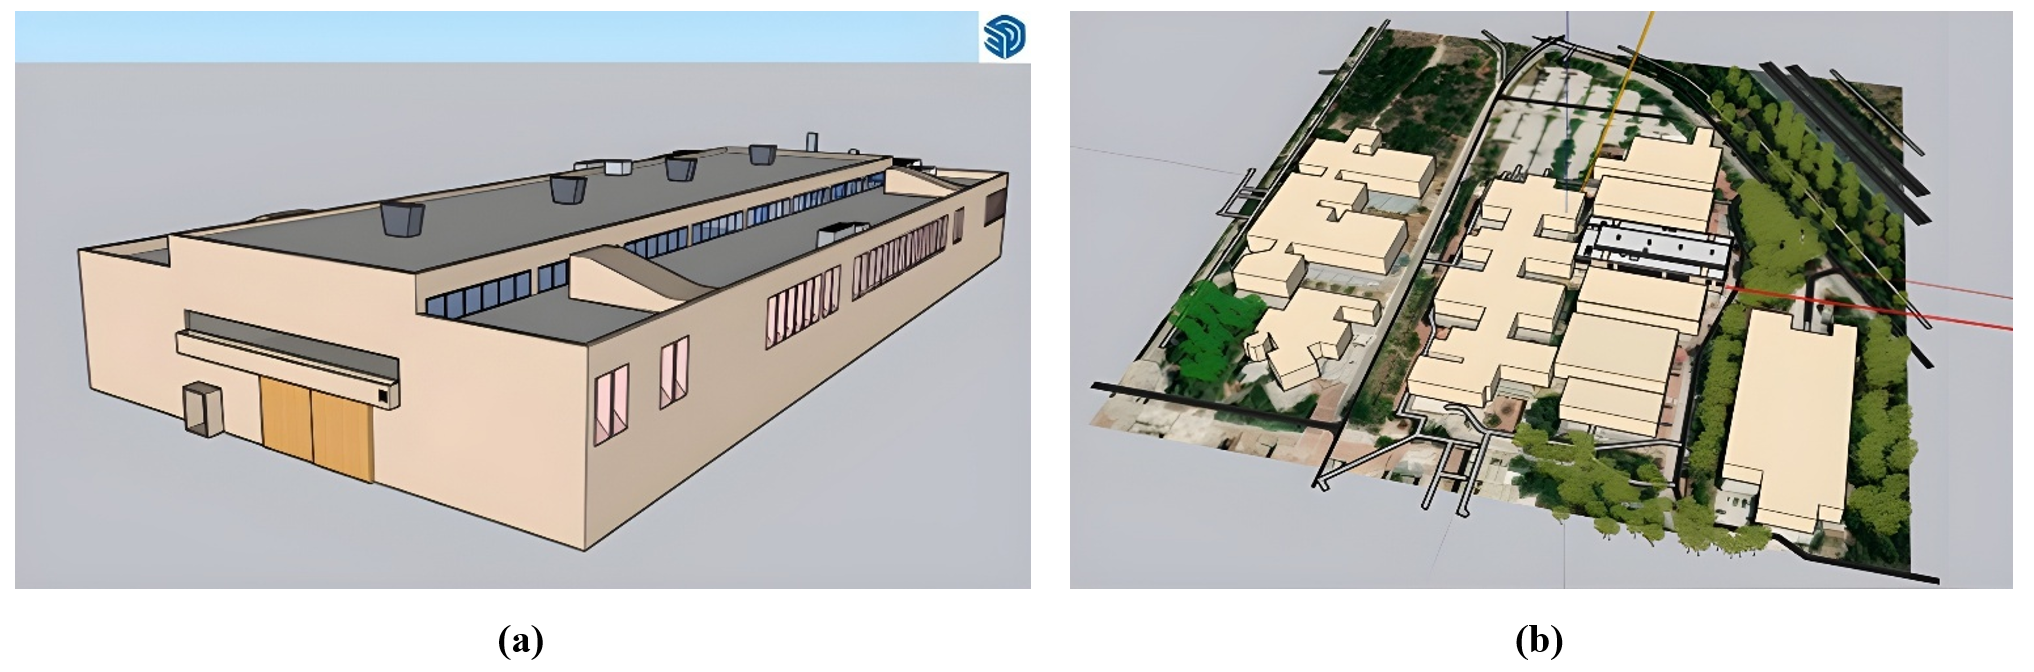
Figure 1 Examined site. (a) The examined university building designed in the environment of SketchUp, (b) The surrounding terrain of the examined building in the environment of Placemaker.
The design of the surrounding terrain, which is essential for the accuracy of the performance analysis of the photovoltaic system, is completed with the use of Placemaker, a plugin in SketchUp. It includes the integration in the existing layout of roads and pedestrian paths, as well as the integration of surrounding buildings and trees which will play a key role in the shadow analysis that will be performed, as shown in Figure 1.
In this study, a detailed shadow analysis was performed, because of the important role that shadowing can have on the energy performance of the photovoltaic panels. Shadowing has proved to be responsible for significant reductions in energy output. One of the main reasons is the reduced available area of the photovoltaic panels. Moreover, since the panels can be connected in series or parallel in an array, the shadowing of one panel or even of a cell can reduce the current flow for the entire string, causing a disproportionate drop in energy production. This can reduce the energy output by even more than 50%, even if only 10–20% of the photovoltaic panel is shaded [10]. Additionally, a shaded part of a panel can act as a load, converting power to heat and this can lead to the creation of hot spots, which can cause damage to the panel, affecting its production and lifespan [11]. The meteorological inputs used in this analysis were derived from Typical Meteorological Year (TMY) datasets from Skelion, which provide representative climate conditions necessary for accurate energy performance modeling.
SketchUp and Skelion, a solar systems’ design plugin for SketchUp, provide some tools for the shadow projection and solar obstructions design on a surface, which for the present study is the roof of the designed university building. These tools not only include the projection of the shadows of neighboring buildings and trees on the roof but also the design of the outline of shadows on the roof for a selected timeframe before and after the solar noon. Given the geographical location and orientation of the building, the shadow projection and design are completed with the use of a model with simple geometrical equations, as described in the following example of the shadow calculation of the building shown in Figure 2.
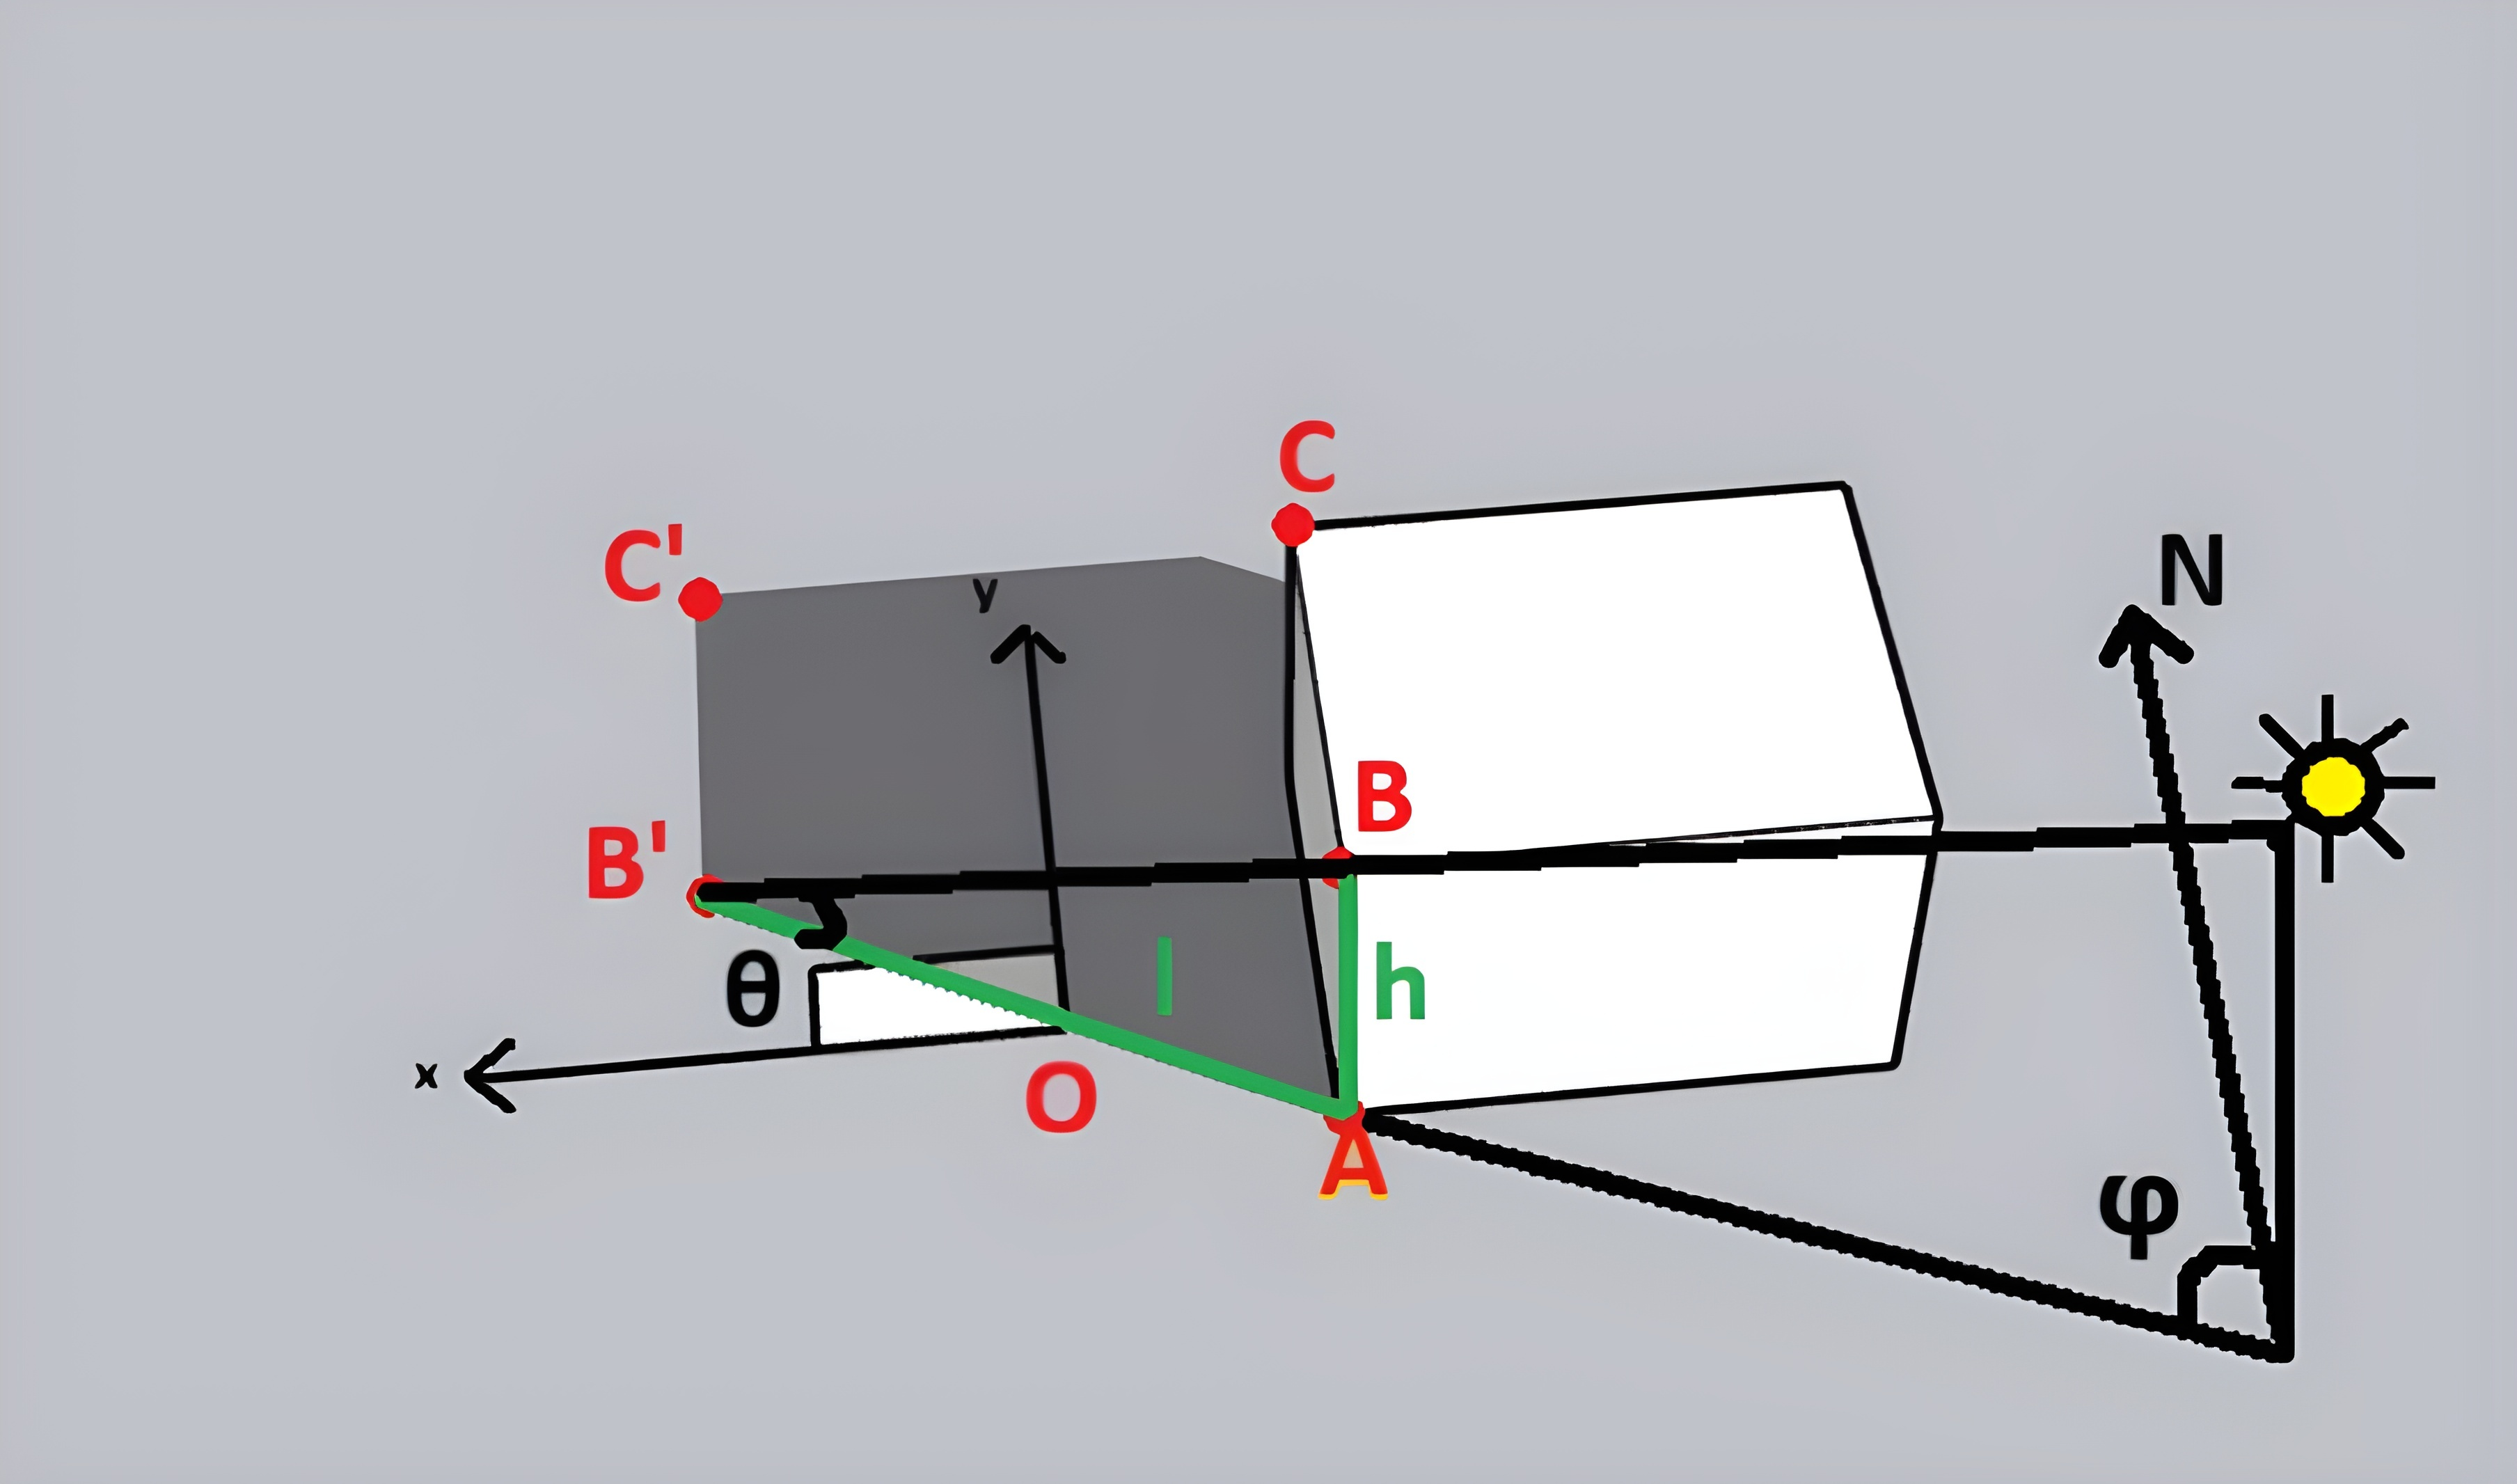
Figure 2 Schematic representation of the shadow analysis calculations.
As shown in Figure 3, the position of the sun at the specific time of the day leads to the fact that the building's western wall casts a shadow, whose dimensions will be calculated through the determination of the coordinates of the edge points.
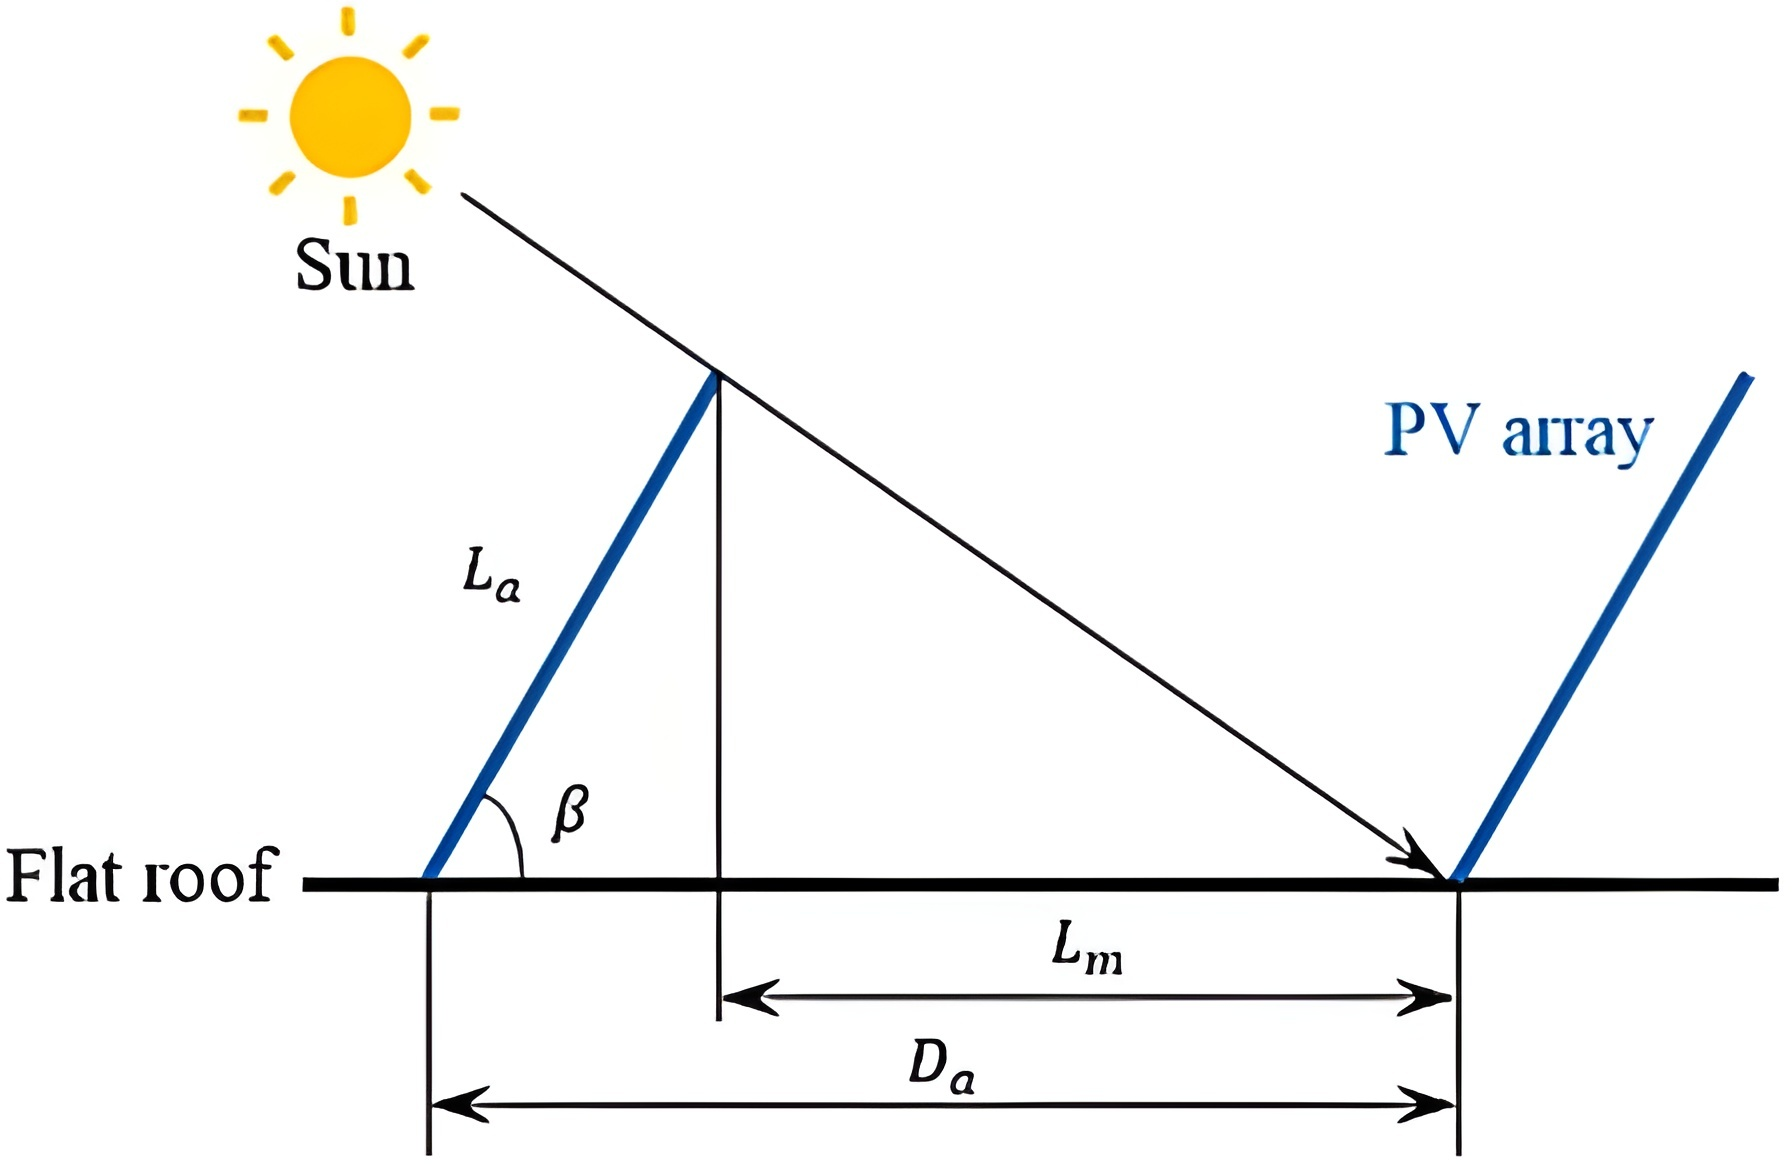
Figure 3 Minimum distance between two different rows of photovoltaic panels to minimize shadow losses.
The shadow projection of the southwest side of the building (A-B), with height equal to H, is equal to A-B’ and its length (l) is calculated by the following equation, where
For a surface at the level of zero height, a coordinate origin (O) is defined at its southeast corner. The coordinates of the building’s point A are:
Then, the coordinates of the projected point B’ (xB’, yB’), can be calculated with the use of the following equations.
Respectively, the coordinates of the projected point C’ can be calculated, which leads to the determination of the shaded area.
The photovoltaic panels installed on roofs in urban areas are usually installed in rows. In these cases, the rows must be arranged in a way that the shadow of the previous row does not affect the next one. For the determination of this minimum distance between the rows, the calculations are being conducted considering the day of the winter solstice (21st of December), when the solar elevation is at its minimum. Another important factor with an immediate effect is the geographical location of the location where the panels are installed, as well as the orientation and inclination angle of the installed photovoltaic panels.
The minimum distance between two different rows of photovoltaic panels to minimise the shadowing losses (Da) is calculated using the following formula, where (La) and (φ) are the length of the PV array inclination plane and the latitude of the installation location, respectively, as shown in Figure 3.
In accordance with the aforementioned regarding the shadow analysis of the present study, the determination of the percentage of losses because of shadowing, for each photovoltaic panel installed was completed. In addition to that, the photovoltaic panels, whose losses due to shadowing exceeded the selected maximum limit, were finally removed. Thus, the energy performance of the photovoltaic system installed was increased.
Both the tilt angle (angle between the panel and the horizontal plane) and the orientation (azimuth) angle of a photovoltaic panel have a significant effect on the energy efficiency of the panel. The optimal angles can differ among different photovoltaic systems, so in this study in order to achieve the maximum possible efficiency, the optimal angles were calculated with the use of the Solar Orientation Factor (SOF). The SOF can be calculated by dividing the solar energy available at the actual tilt and orientation of the surface, by the solar energy that would be available at the surface with optimal tilt and orientation, as described by the following equation.
SOF values range from 0 to 1 (or 0% to 100%), where the maximum value corresponds to optimal orientation. In the present study, SOF was calculated using Skelion, parametrically in relation to the different possible combinations of tilt and orientation angles.
One of the scenarios that were investigated in this study was the comparison of the total energy produced by different types of photovoltaic panels. The basic parameters of the solar panels that were used are presented in Table 2. Their evaluation was completed with an emphasis on their antagonizing characteristics, such as nominal power and efficiency against panel area, in order to determine the most suitable type of panel for the needs of the study (designed building with the specific available area on the roof). A temperature coefficient of Power equal to -0.35%/°C [12] and a module degradation rate of 0.7% per year [13] were used to account for the impact of temperature variations on panel output and the gradual efficiency loss over time.
Table 2 Basic specification parameters of the solar panels used in the present study.
The type of the photovoltaic panel that had the higher energy efficiency was also used in the scenario where the panels were installed with a west orientation. This case has been investigated comprehensively in recent years, as it might lead to a lower energy production in total, but it provides a higher production in the hours after noon and until sunset, when the energy demand is also higher.
In addition to the aforementioned scenarios, this study includes the analysis of Building Integrated Photovoltaics (BIPV) and Building Applied Photovoltaics (BAPV) systems installed in the designed building. In a BIPV system, the photovoltaics can be used to replace conventional construction materials of the building’s envelope, which leads to a relatively lower initial investment cost due to the reduction in expenses for conventional building materials and labor. The characteristics of the photovoltaic panels used in the BIPV scenario are shown in Table 3.
Table 3 The characteristics of the photovoltaic panels used in the BIPV scenario.
Regarding the BAPV system examined in this study, the photovoltaic panels were installed in the exterior of the building envelope, leaving a gap of 0.45 m between the panels and the building. This distance, along with the appropriate airflow, allows the cooling of the photovoltaic panels and thus the improvement of their efficiency, but it also reduces the thermal loads of the building [14,15]. As a result, not only the total energy produced is higher, but also the total energy demand of the building is lower.
For every scenario investigated in the present study an economic analysis was conducted with the calculation of the basic financial metrics Net Present Value (NPV), Internal Rate of Return (IRR), and Payback Period (PBP). NPV is the sum of the difference between the present value of cash inflows and the present value of cash outflows over a period of time. If the value of NPV is positive, it means that the project is profitable in contrast to cases where NPV has a negative value which are not financially viable [16]. NPV is calculated through the following formula where (Ct) is the cash flow at the specific time (t), (n) is the total number of periods, (r) is the discount rate, and (C0) is the initial investment (cash outflow at time t=0).
Regarding IRR, it is the discount rate at which the NPV of the cash flows from a case equals zero and when it is calculated to be higher than the required rate of return, the project is considered profitable. PBP is the amount of time needed to generate enough cash flow to cover the initial cost of a project and the shorter it is the more financially attractive the project is considered. For the calculation of the aforementioned factors, the parameters presented in the following Table 4 were used.
Table 4 Parameters used for the economic analysis.
For the calculation of these factors, three different scenarios (optimistic, baseline, and pessimistic) were considered, with different values in key parameters such as energy selling price, tax rate, loan interest rate, maintenance and operating costs, discount rate, evaluation period, and loan repayment terms to reflect a range of possible future conditions.
After designing the building, the surrounding area, and defining the geographical location (longitude and latitude), the shadows’ projection on the roof of the university building for the day of winter solstice is completed with the use of Skelion, as shown in Figure 4, at 12:00 and 15:00 respectively.
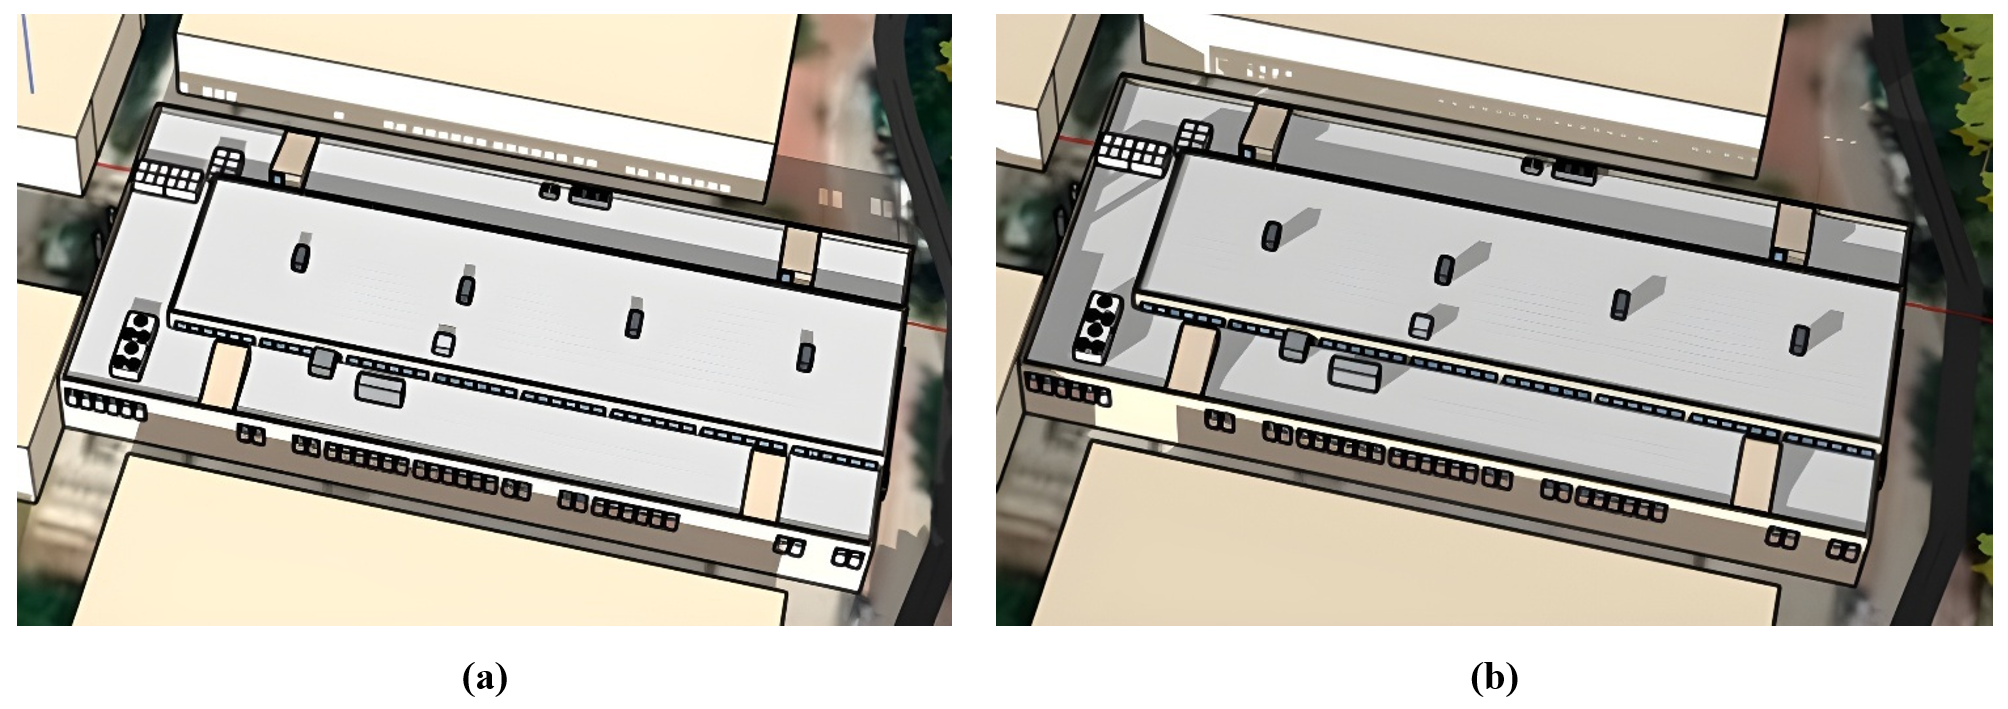
Figure 4 Shadows’ projection on the roof of the university building at (a) 12:00 and (b) 15:00.
Additionally, the shadows’ design on the roof of the university building for the time frame between 09:00 and 15:00 on the day of the winter solstice is shown in Figure 5. As can be observed from Figure 5 most of the surface of the peripheral sector of the roof will be affected by shadowing for some time during the aforementioned timeframe, while on the contrary most of the central sector of the roof will not be affected and thus lead to a greater area available for PV installation and a higher energy production for this sector.
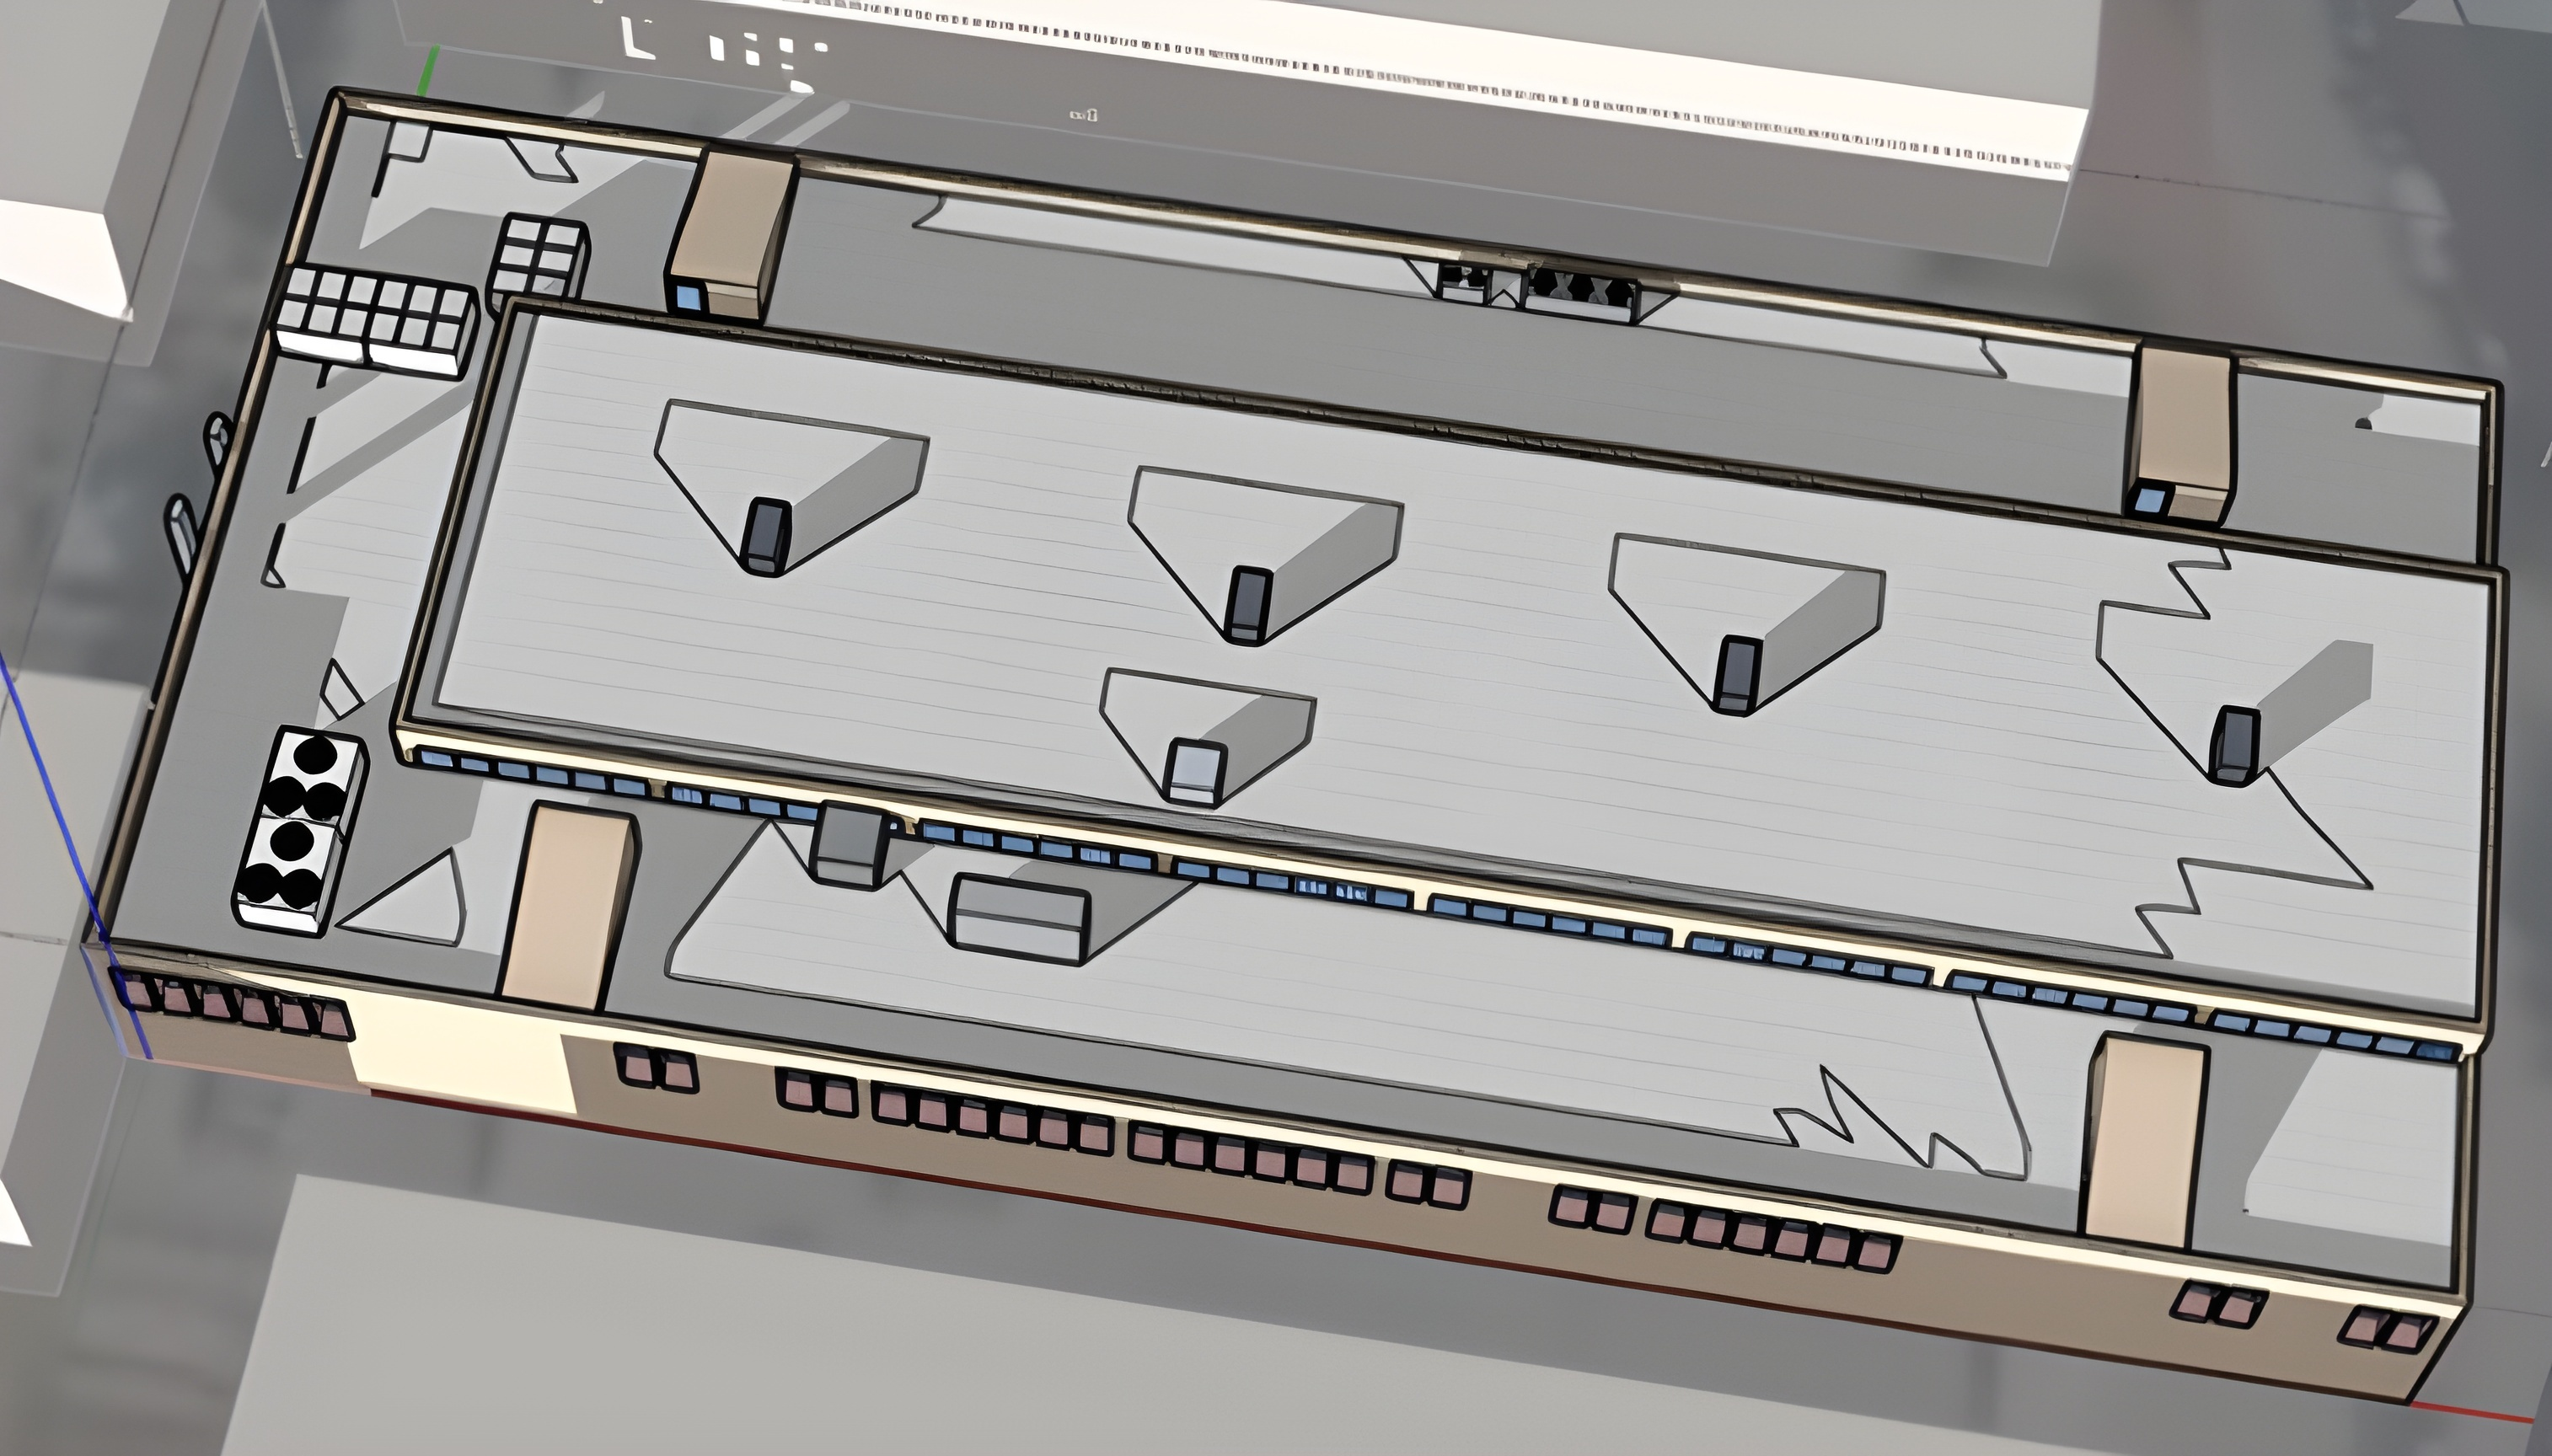
Figure 5 Shadows’ representation on the university building’s roof for the time frame between 09:00 and 15:00.
Figure 6 depicts the variation of the SOF factor for various tilt and orientation angles on the roof of the university building and the variation of the SOF factor for different tilt angles for an orientation angle equal to 180°, when the relative tilt follows the north-south orientation (black line) or opposite direction (blue line). The maximum value of the SOF factor is equal to 100% and is observed when the tilt angle is equal to 30° and the orientation angle is equal to 180°.
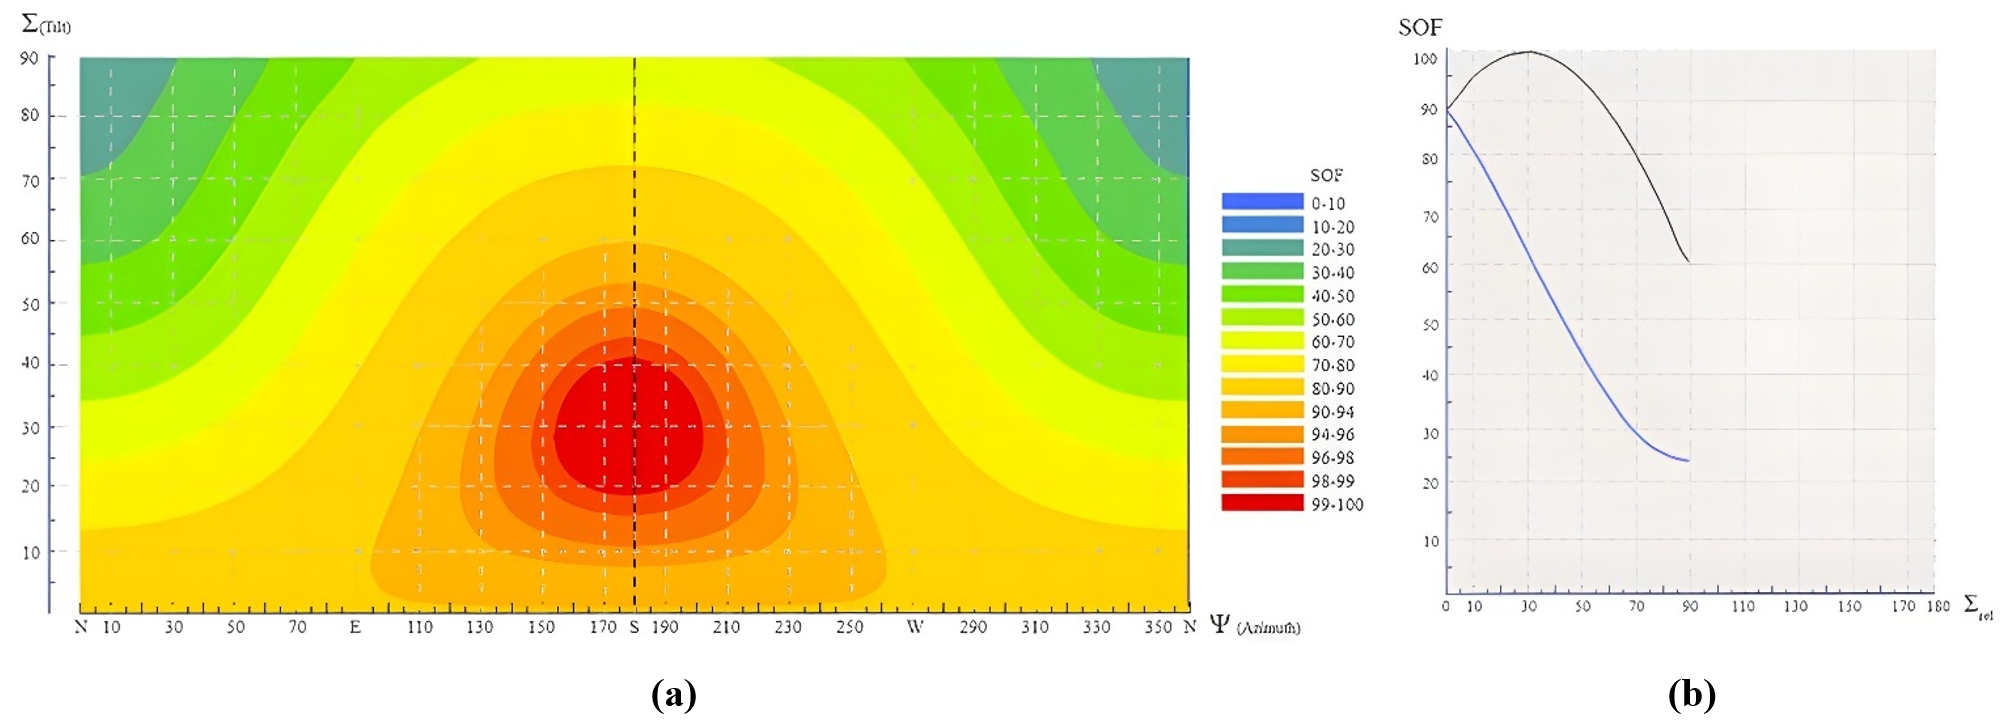
Figure 6 Shadow Orientation Factor (SOF) on the roof of the university building. (a) SOF factor for various tilt and orientation angles, (b) SOF factor for different tilt angles for orientation angle equal to 180°.
Figure 7 depicts the calculation of the energy losses due to shadowing and the removal of photovoltaic panels whose shadow losses exceed the permissible limit, which in this study was selected at 10%.
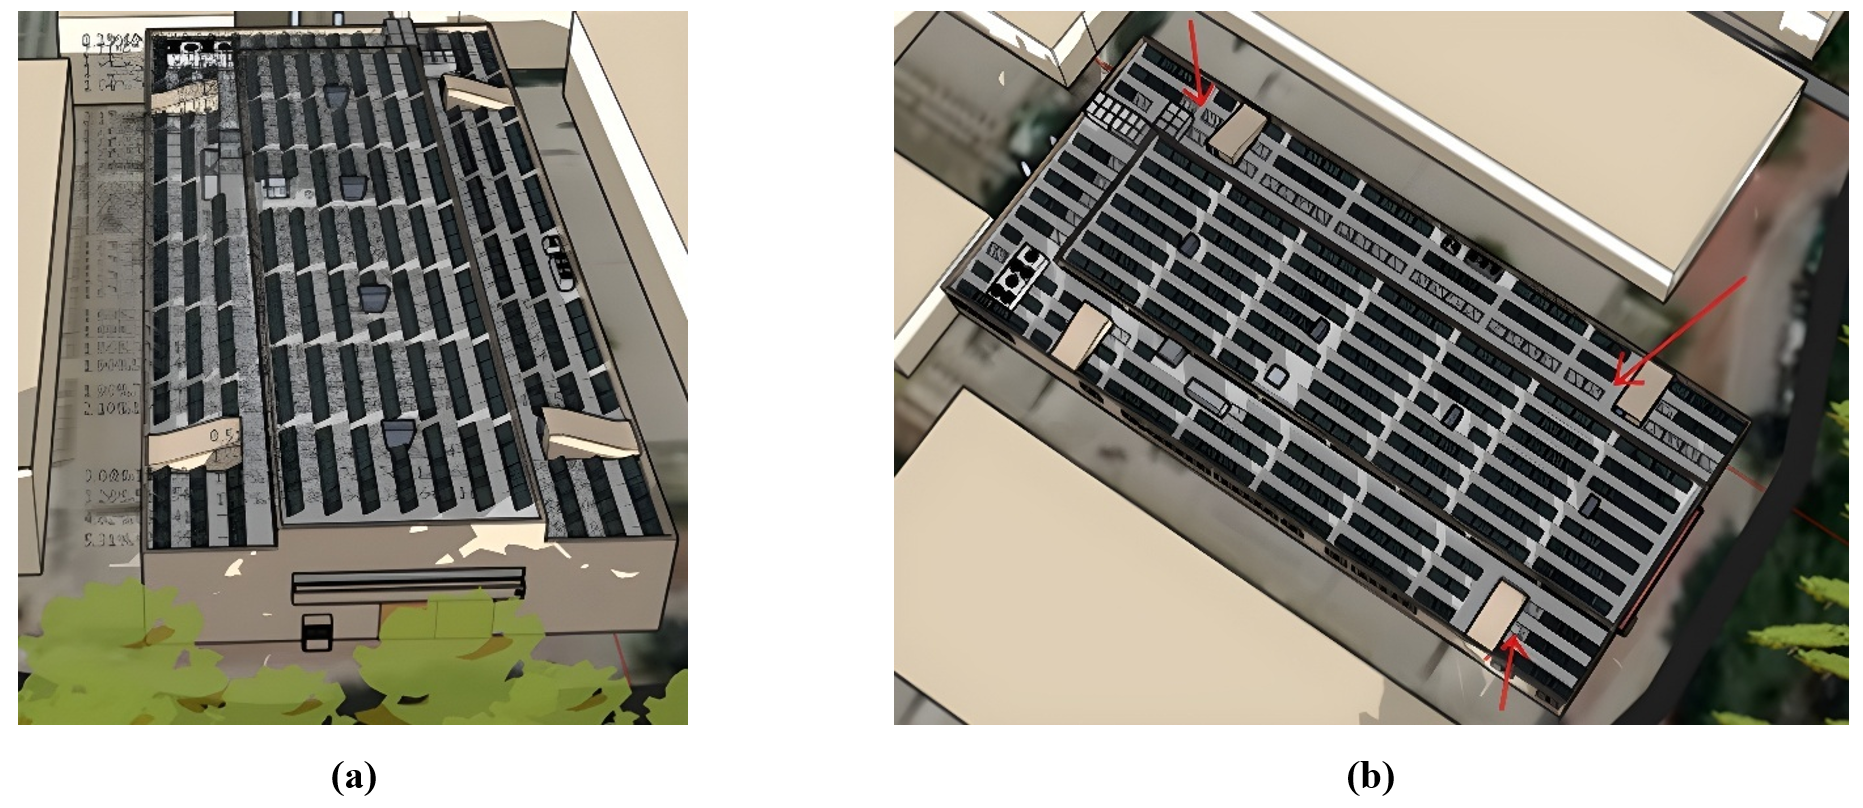
Figure 7 Effect of shadows on energy production. (a) Calculation of energy losses due to shadowing, (b) removal of photovoltaic panels with losses that exceed the permissible limit.
As shown in Table 5 the calculations are completed for six different simulation scenarios regarding different permissible limits of shadow losses. In each scenario, the number of photovoltaic panels installed, and the annual energy produced are calculated for both the central and the peripheral sectors of the roof of the university building. Additionally, the total energy produced per installed area for the whole roof is calculated and the results are also depicted in Figure 8. As observed, the peripheral sector has a greater variation than the central, due to the fact that it is more affected by shadowing as shown in the aforementioned Figure 6.
Table 5 Simulation studies for different threshold shadow levels.
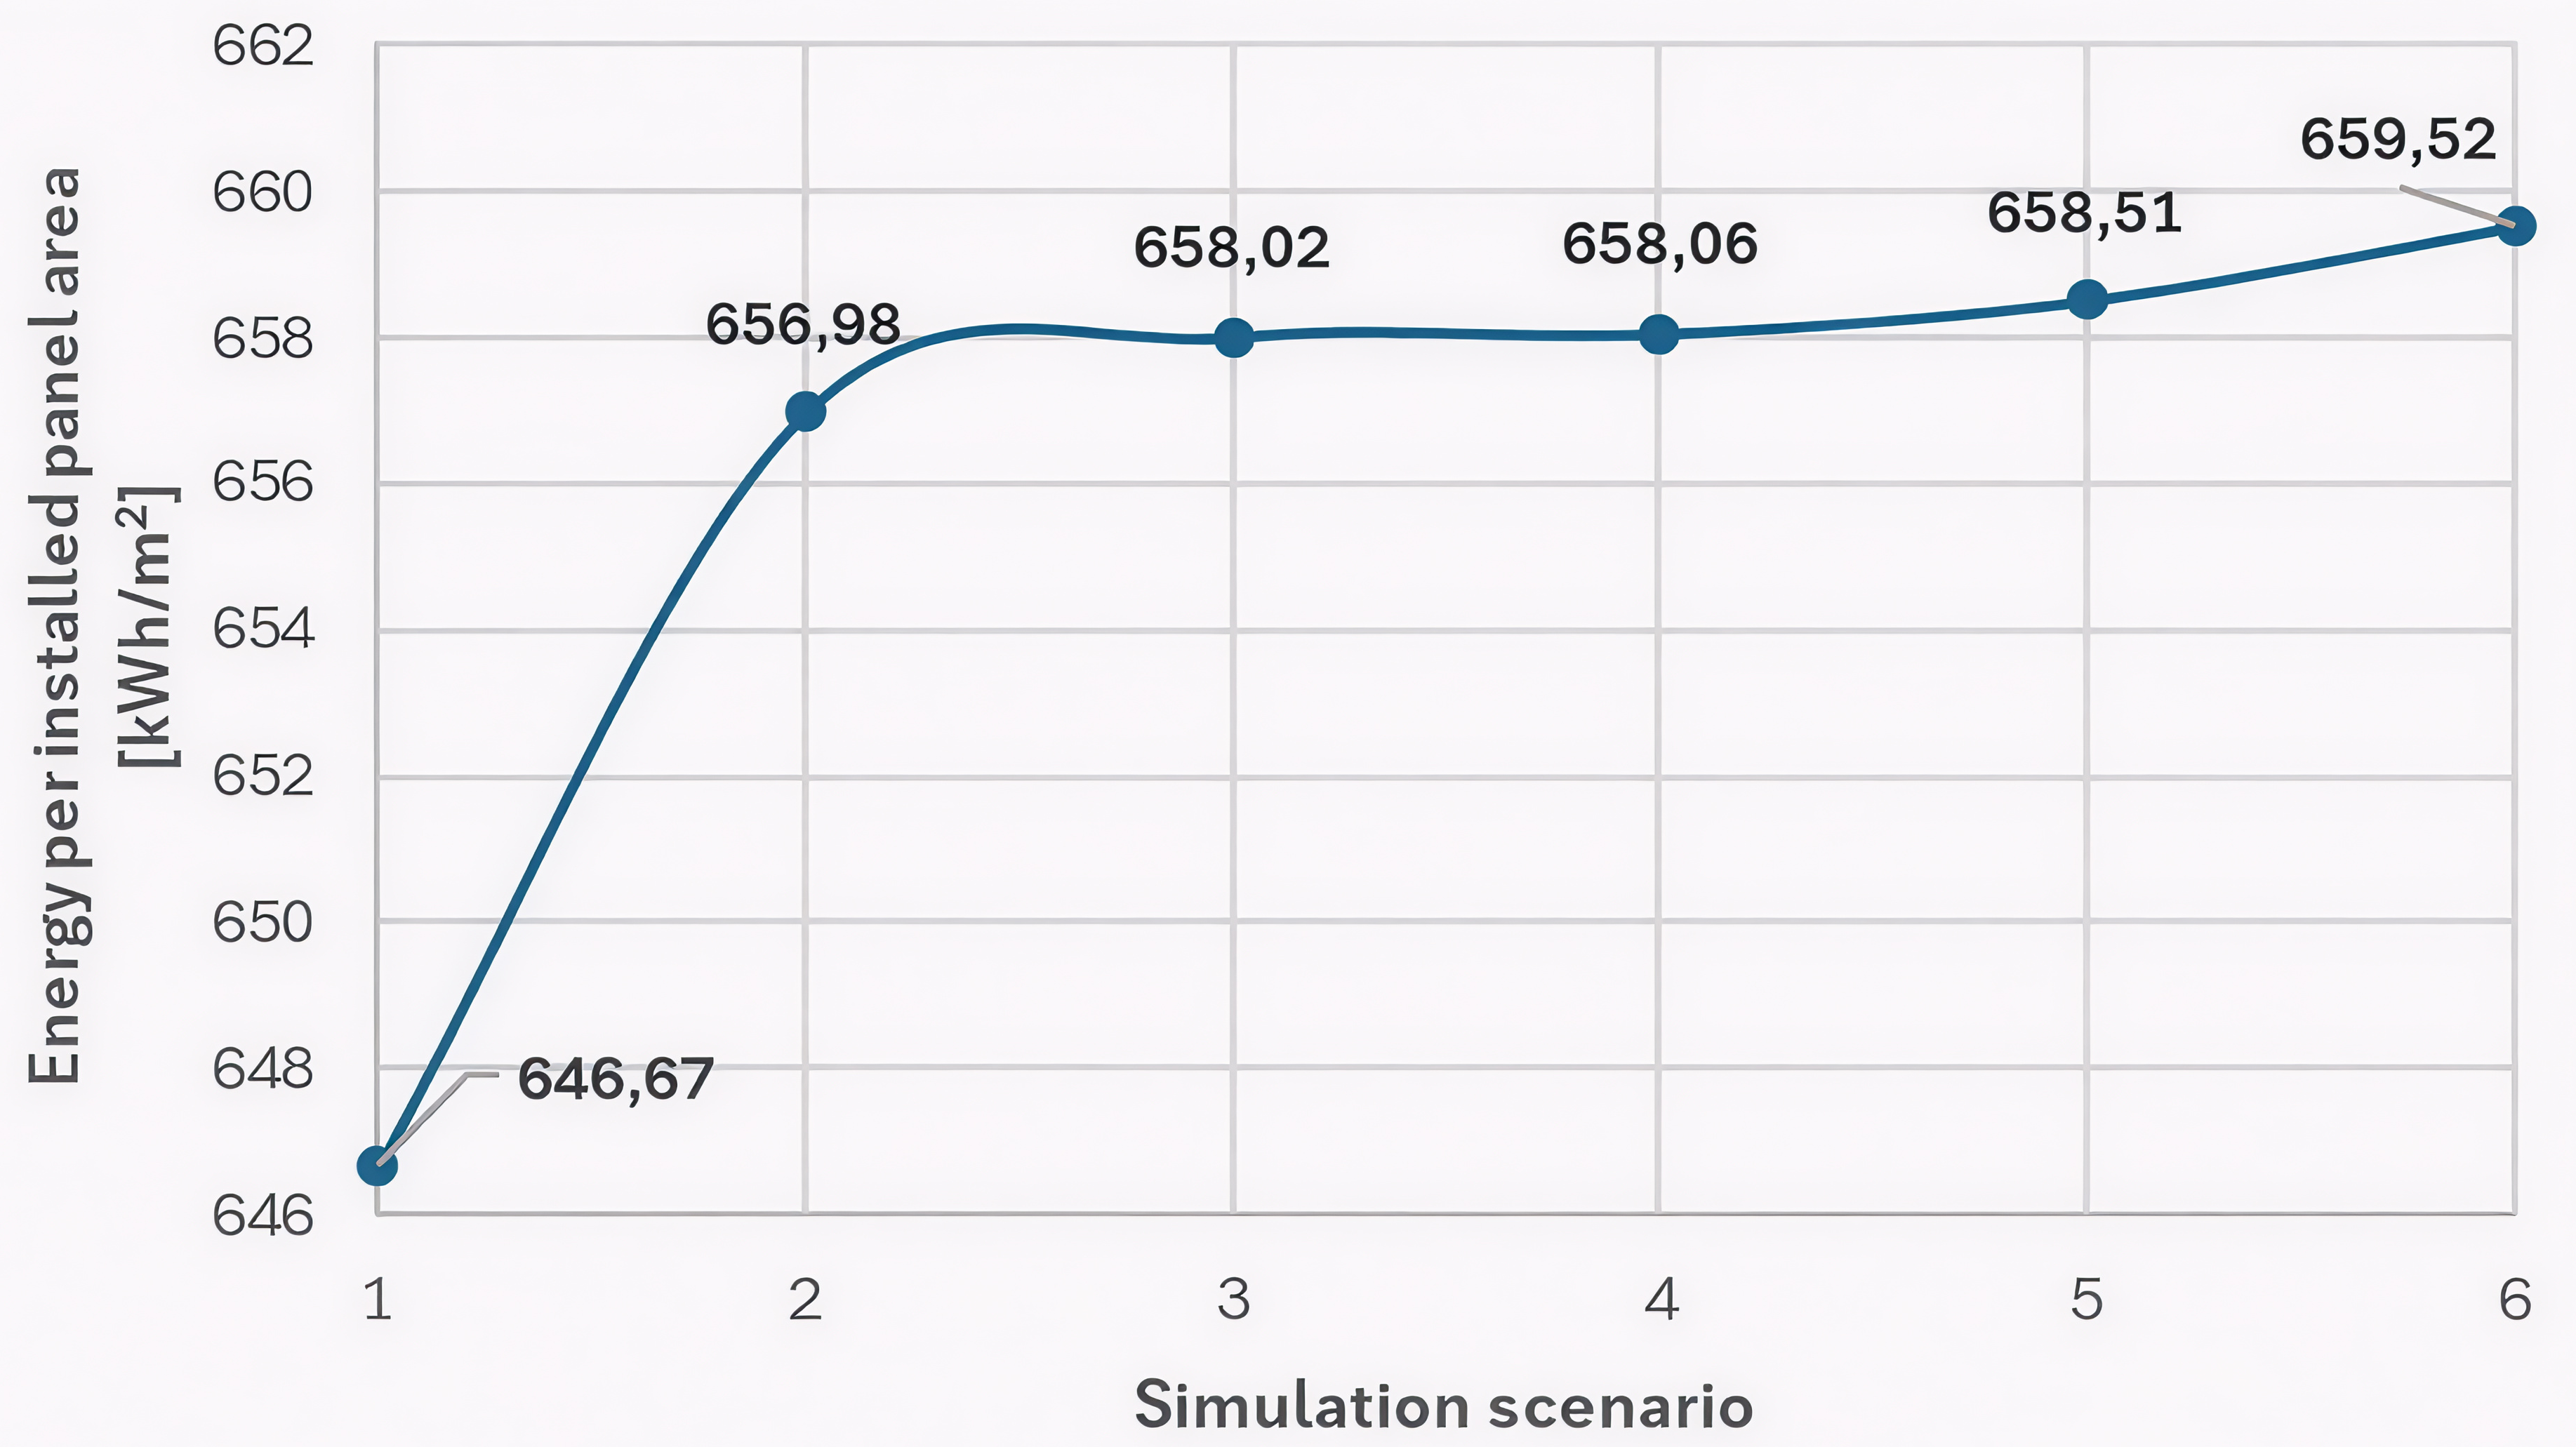
Figure 8 Total energy in kWh/m2 for all the available roof area.
Table 6 presents the calculation of the basic financial metrics (baseline scenario) completed for the baseline case, where different types of photovoltaic panels are installed on the roof of the university building. As can be observed, the project is more financially attractive when the Longi LR4-72HPH 455M panel is selected, which is also used in the rest of the scenarios. All three scenarios (baseline, optimistic and pessimistic) yielded profitable results.
Table 6 Basic financial metrics for the baseline scenario.
Figure 9 depicts the installation of photovoltaic panels on the roof of the university building with a west orientation and the results of the simulation for this alternative scenario. As can be observed, the total energy production when the photovoltaic panels are installed with an orientation angle equal to 200° is 165.3 MWh, leading to a reduction of 33.1% compared to the production of 247.1 MWh when the orientation is 180°.
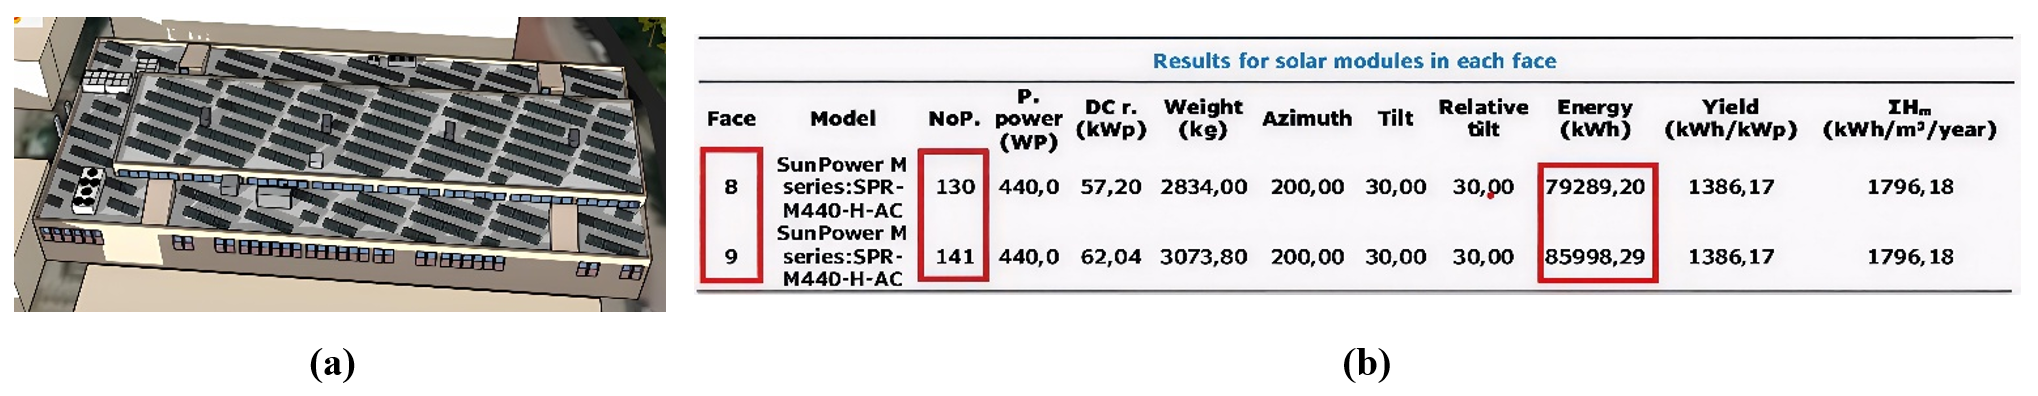
Figure 9 West oriented photovoltaic panels. (a) Installation of photovoltaic panels with a west orientation, (b) results for west-oriented panels.
Figure 10 depicts the installation of photovoltaic panels in the BIPV and BAPV scenarios. Both scenarios are investigated assuming a standalone building. A different type of photovoltaic panel was used in each scenario. While in the BIPV scenario the area of the windows is not covered with photovoltaic panels, in the BAPV scenario the whole surface of the side of the building is exploited, which increases the energy potential of the building while decreasing its thermal loads.
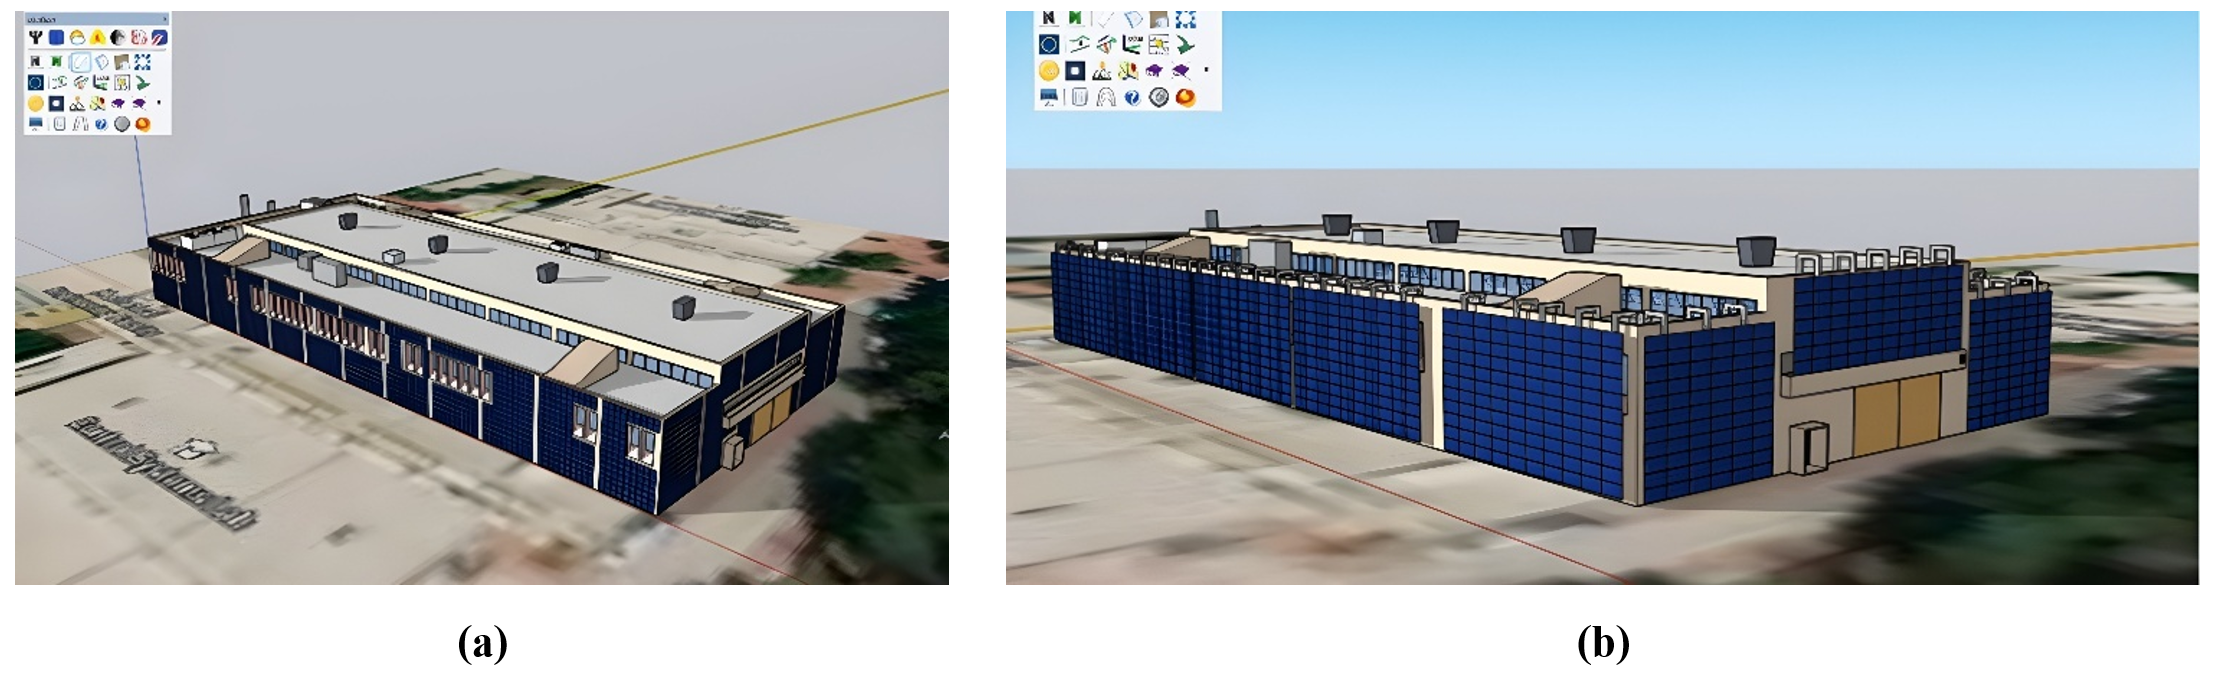
Figure 10 Installation of photovoltaic panels in the: (a) BIPV scenario, (b) BAPV scenario.
Table 7 presents the results of the simulation for the BIPV scenario whereas Table 8 depicts the results of the BAPV scenario. As can be observed in both scenarios, the south side of the building is responsible for the highest energy production (54.5 MWh and 43.6 MWh respectively), but considering the surrounding buildings, the south orientation is not an option, so the west and east orientation are considered as valuable. One of the reasons for the differences between the total energy production of the BIPV and BAPV systems is the model of the photovoltaic panels used in each scenario. Additionally, the higher number of photovoltaic panels installed on the east side of the building in the BIPV scenario is responsible for the higher energy production in comparison with the west side of the building.
Table 7 Simulation results for the BIPV scenario.
Table 8 Simulation results for the BAPV scenario.
In this work, the installation of a photovoltaic building on the roof of a university building as well as alternative solutions are investigated in both efficiency and financial terms. The proposed approach of this study combines multiple tools within the SketchUp and Skelion environment to perform an integrated analysis, including accurate 3D-based shadow simulation, spatial system configuration, energy yield estimation, and scenario-based financial evaluation. This combination enables a more holistic and practical assessment of PV system performance under real-world design constraints. The methodology is adaptable and can be applied to various building types and contexts, enhancing its generalizability and providing valuable insights for both technical design and early-stage investment decision-making. The shadowing effect of neighboring buildings and obstacles is taken into consideration for the determination of the available area for photovoltaic panel installation. Additionally, the calculation of the SOF factor indicates that the optimal angles for the panels’ installation are 180° for the orientation angle (south orientation) and 30° as a tilt angle, which are in accord with the respective literature regarding the geographical location of the building. After the installation of the photovoltaic panels on the roof is complete, the calculation of losses of each panel individually due to shadowing is conducted and then the ones with losses exceeding a permissible limit are removed. Thus, the efficiency of the system can be improved by 14.3%, with a permissible limit equal to 4.0%. Regarding the alternative solutions examined in the present study, the installation of panels with a west orientation equal to 200° resulted in a reduction in the total energy production of 33.1%, not only because of the lower efficiency of the panels for the specific orientation angle in comparison to the optimal one of 180°, but also because of the geometry of the building which affects the number of panels installed. The BIPV and BAPV solutions examined revealed a potential energy production of the east and west sides of the building equal to 39 MWh and 25.1 MWh respectively. The south orientation is not considered an option due to the surrounding buildings and other obstacles.
The optimal scenario regarding efficiency and profit, among those examined in the present study, proposed for the installation of a photovoltaic system on the roof of the university building examined in the present study includes the installation of 397 photovoltaic panels both in the central and peripheral sectors of the roof. The orientation angle should be 180° whereas the tilt angle 30° and, as a result, the total energy production is equal to 247 MWh. Additionally, the financial metrics calculated for the best scenario include an NPV equal to 9448 €, an IRR equal to 13.8% and a PBP equal to 9 years, all indicating a profitable investment. One of the most important conclusions of the present study is that shadowing is a very important investigation parameter for the installation of photovoltaic systems. Additionally, another important conclusion is that other possible solutions such as BIPVs and BAPVs could increase significantly the total energy production of a system installed on a building, as well as that an overall economic analysis is essential for a holistic comparison of all the possible solutions.
In the future, it will be useful to conduct a study to examine the validation of the modeled outputs against measured or empirical data from a similar installation. Additionally, there could be an investigation for the thermal and cooling loads of the building after the installation of a BAPV photovoltaic system, as well as one for the energy consumption of the building and the other buildings of the campus and determination of the percentage of these consumptions that can be provided from the installation of a larger photovoltaic system. Finally, it would be essential to investigate the performance of a BAPV system integrated with an electricity storage system (batteries) or directly connected with the electricity grid.
Data will be made available by the authors on request.
The first author would like to thank the Special Account Research Funds of the National Technical University of Athens for its financial support.
The authors have declared that no competing interests exist.
Conceptualization: E.V., C.S. and E.B.; Methodology: E.V. and C.S.; Software: E.V., E.B. and D.K.; Validation: E.V., C.S. and E.B.; Formal Analysis: E.V.; Investigation: E.V., A.K. and E.B.; Resources: E.B. and C.T.; Data Curation: E.V., P.L. and C.S.; Writing – Original Draft: E.V.; Writing – Review & Editing: E.B., A.K., C.S., P.L. and C.T.; Visualization: E.V., E.B. and D.G.; Supervision: E.B. and C.T.; Project Administration: C.T.; Funding Acquisition: E.V. and C.T.
| 1. | Zheng W, Xiao H, Pei W. Distributed-regional photovoltaic power generation prediction with limited data: A robust autoregressive transfer learning method. Appl Energy. 2024;380:125058. [Google Scholar] [CrossRef] |
| 2. | Zhang C, Li D, Wang L, Zhang S, Shen C, Gao R. A real-time controllable pressure-driven smart window with Cu2+ solution. Energy Build. 2024;329:115236. [Google Scholar] [CrossRef] |
| 3. | Wei W, Feng Z, Sun Y, Wang W, Jin X, Zhang J., et al. Experimental investigation on the space heating performance of air source heat pump with vapor injection under frosting condition. J Build Eng. 2024;90:109327. [Google Scholar] [CrossRef] |
| 4. | Lu M, Sun Y, Ma Z. Multi-objective design optimization of multiple energy systems in net/nearly zero energy buildings under uncertainty correlations. Appl Energy. 2024;370:123620. [Google Scholar] [CrossRef] |
| 5. | Holloway ML. The oil and gas state adds renewable wind and solar. Cambridge, USA: Academic Press; 2021. p.249-62. |
| 6. | Marí Soucase B, Aleman JP, Guaita-Pradas I. Design of a solar system installation in Marrakesch using the SKELION software tool. Proceedings of 2016 International Renewable and Sustainable Energy Conference (IRSEC); 14-17 Nov 2016. Marrakech, Morocco. p.717-721. [CrossRef] |
| 7. | Tian S, Yang G, Du S, Zhuang D, Zhu K, Zhou X., et al. An innovative method for evaluating the urban roof photovoltaic potential based on open-source satellite images. Renew Energy. 2024;224:120075. [Google Scholar] [CrossRef] |
| 8. | Zhu X, Lv Y, Bi J, Jiang M, Su Y, Du T. Techno-Economic Analysis of Rooftop Photovoltaic System under Different Scenarios in China University Campuses. Energies. 2023;16(7):3123. [Google Scholar] [CrossRef] |
| 9. | Aktas IS, Ozenc S. A case study of techno-economic and environmental analysis of college rooftop for grid-connected PV power generation: Net zero 2050 pathway. Case Stud Therm Eng. 2024;56:104272. [Google Scholar] [CrossRef] |
| 10. | How to mitigate shading losses in PV systems? [Internet]. PVcase; 2021 Available from: https://pvcase.com/blog/how-to-mitigate-shading-losses-in-pv-systems/. |
| 11. | Ikejiofor OE, Asuamah YE, Njoku HO, Enibe SO. Detection of Hotspots and Performance Deteriotations in PV Modules under Partial Shading Conditions Using Infrared Thermography. Eng Proc. 2020;2:71. [Google Scholar] [CrossRef] |
| 12. | Basant Raj P, Imenes AG. Investigation of Temperature Coefficients of PV Modules through Field Measured Data. Sol Energy. 2021 Aug;224:425-439. [Google Scholar] [CrossRef] |
| 13. | Abdelouahed A, Elmamoun S, Berrada A, Ameur A. Photovoltaic Modules Degradation Assessment Using Different Statistical Techniques. Int J Energy Res. 2022;46:16593-16607. [Google Scholar] [CrossRef] |
| 14. | Elbakheit AR, Waheeb S, Mahmoud A. A Ducted Photovoltaic Façade Unit with Forced Convection Cooling. Sustainability. 2022;14(19):12875. [Google Scholar] [CrossRef] |
| 15. | Elbakheit AR. A Ducted Photovoltaic Façade Unit with Buoyancy Cooling: Part I Experiment. Buildings. 2019;9(4):88. [Google Scholar] [CrossRef] |
| 16. | Fernando J. Net present value (NPV): What it Means and Steps to Calculate It [Internet]. Investopedia; 2024 Available from: https://www.investopedia.com/terms/n/npv.asp. |

![]()
Copyright © 2026 Pivot Science Publications Corp. - unless otherwise stated | Terms and Conditions | Privacy Policy


